Economy Still Too Strong to Induce Stocks Bear Market Recession
Stock-Markets / Stock Markets 2018 May 28, 2018 - 08:18 AM GMTBy: Troy_Bombardia
 The adage “the stock market is not the economy” is true on a day to day and week to week basis. But it isn’t true in the medium-long term. The stock market and the economy move in the same direction over the long term. This means that you can predict the future of the stock market by predicting the future of the economy (fundamentals).
The adage “the stock market leads the economy” is true, but only when you look at the “economy” through the lens of GDP. These charts show that the stock market topped before a recession started in the 4 historical bear markets since 1950.
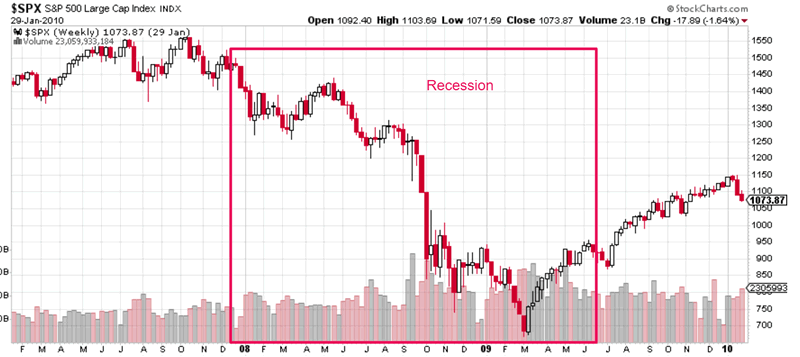
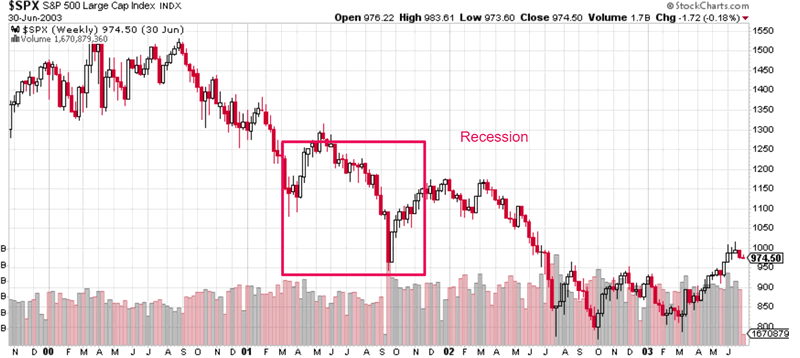
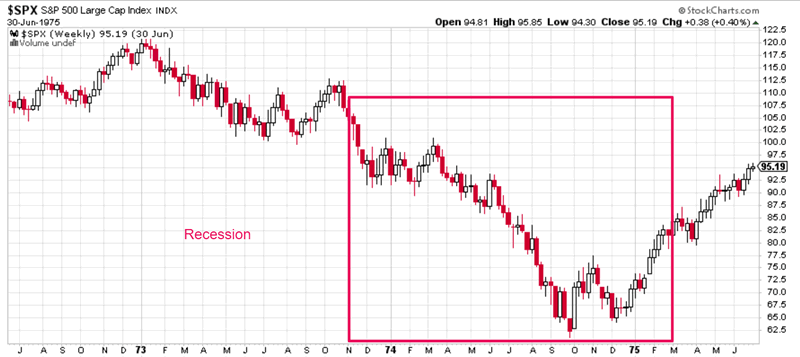
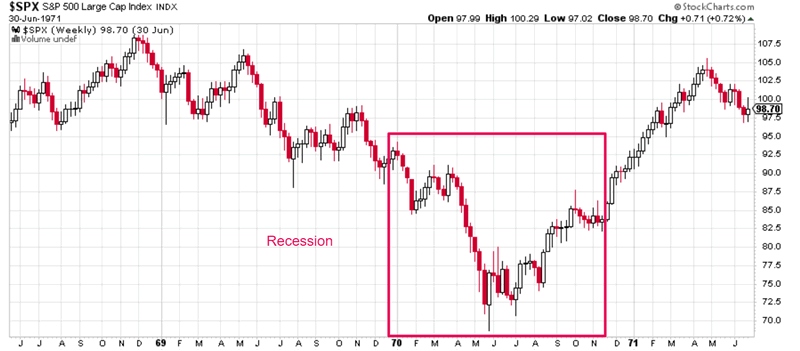
However, this merely means that we cannot use the start date for recessions to predict equity bear markets. We need to use indicators that LEAD GDP. Leading economic indicators allow us to get closer to the bull market’s top for a more accurate and timely SELL signal. Remember, selling too early is just as bad as selling too late.
The real sequence of events for bull market tops looks like this:
- Leading economic indicators start to deteriorate.
- The stock market tops and economic growth continues to deteriorate.
- The economy enters into a recession (negative growth), which accounts for the bulk of the stock market’s decline.
*Note: bear market bottoms have little to do with the end date of recessions.
Dr. Ed Yardeni – one of the best economists – doesn’t foresee an economic recession for 2018 or 2019. He’s making no predictions right now about 2020. “Ask me about that in 2019” he says. I agree with his philosophy. Predict the next 1-2 steps, not the next 10 steps.
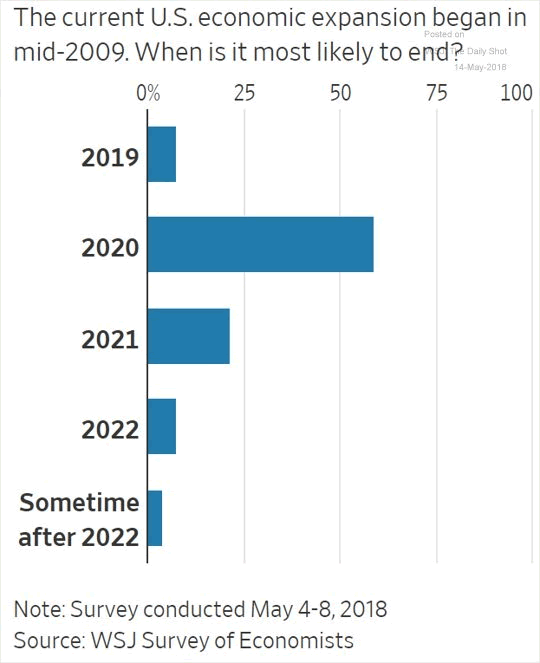
Right now the majority of economists think that a recession will begin in 2020. I think a recession starting in the second half of 2019 is more likely. But I must be flexible if I am to be a good investor and trader. This means that if I don’t see significant deterioration in economic data by the first half of 2019, I will push my recession call further into the future. I update my outlook based on new data.
In fact, wouldn’t it be crazy if the current bull market lasts in 2021? That is an unlikely scenario in my opinion.
With that being said, here are some of my thoughts from this week that explain why the equities bull market and economic expansion still have some more room to run.
The Fed is tightening monetary policy very slowly
Bears like to point to the Fed’s monetary tightening to support their bearish case. But here’s what they don’t understand:
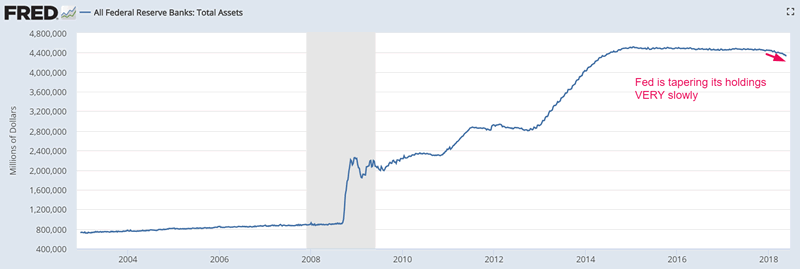
The stock market and economy don’t immediately grind to a halt when the Fed starts to tighten monetary policy. The Fed needs to SIGNIFICANTLY tighten monetary policy before the economic expansion and equities bull market can end.
Perspective is everything. This chart demonstrates that the Fed is tightening monetary policy very slowly. The Fed eased monetary policy like crazy from 2010-2014. The Fed is moving very slowly in reverse because they don’t want to trigger a panic.
Tied with the fear of “Fed tightening” is the fear of “rising interest rates”. But here’s the simple reality. Rates and stocks still have a positive correlation. From Thursday’s post.
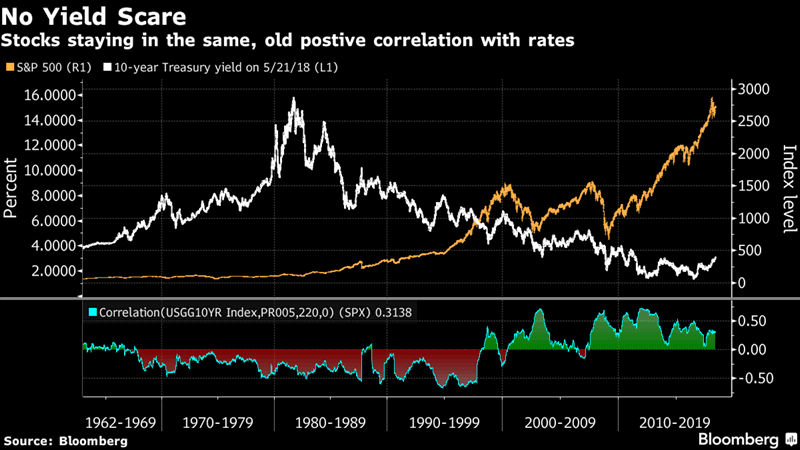
In addition, interest rates are still very low from a historical perspective. The recent “surge” in interest rates barely registers as a blip on longer term charts.
Financial conditions and lending standards are still loose
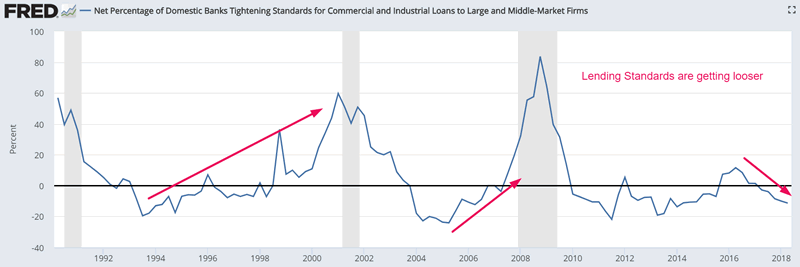
Financial conditions and lending standards tend to tighten before bear markets and recession begin. This makes sense. The world doesn’t turn from sunshine and rainbows into a nightmare in the blink of an eye. There’s a transition process, during which the financial world flashes warning signs.
Financial conditions are still very easy right now, and lending standards are actually becoming looser. Now I know the arguments “loosening lending standards will result in another implosion like 2008”. That may be true. But in the meantime, there’s a lot of money to be made.
From last Sunday’s study: financial conditions are still too easy for a bear market and recession to start.

From Monday’s post:
M&A will probably boom for a few more years
Global M&A is expected to surge in 2018. Surging M&A is typical of late-cycle behavior.
However, the key is that bull markets usually end after M&A booms for several years in a row. 1 year is not enough. This is inherently logical. Bull markets and economic expansion die from excess. M&A deals need to boom for quite some time (i.e. a few years) before there can be full blown excess.
*We used M&A data in an earlier version of the Medium-Long Term Model.
Rising energy costs
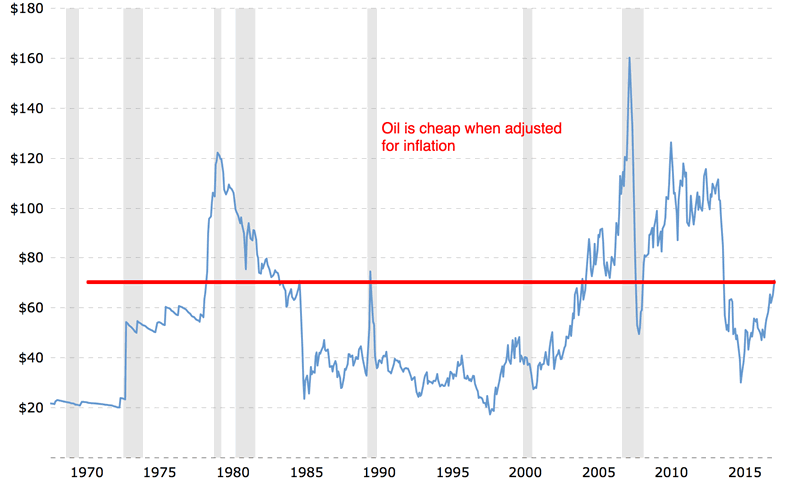
The recent rally in oil probably will not have a significant negative impact on the economy and stock market. From Tuesday’s post:
For starters, oil isn’t very expensive when adjusted for inflation.
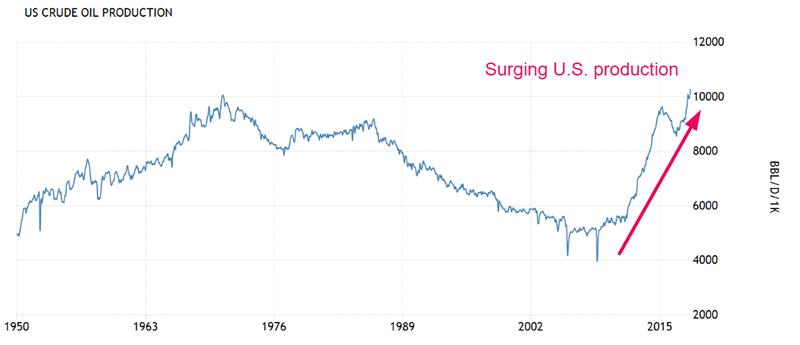
In addition, the U.S.’ oil production is surging. Rising oil prices is increasingly becoming a transfer of wealth from one part of the U.S. (oil consuming states) to another part of the U.S. (oil production states). Transfers of wealth don’t hurt the aggregate economy or stock market. (Higher energy costs for U.S. manufacturers = fatter profits for U.S. energy companies).
This chart demonstrates that U.S. oil production continues to surge thanks to fracking.
Oil’s rally certainly isn’t being helped by the announcement that OPEC and Russia will probably increase the supply of oil in the future. From CNN
And as usual, our leading economic indicators continue to improve, which suggests that the U.S. economy will continue to improve over the next few months. This is why the stock market is heading higher in the long term.
The divergence between the stock market and the economy
The U.S. stock market is still stuck in a correction from January 2018 to present. As the economy continues to improve, the stock market will eventually follow the economy’s lead to the upside.
The S&P 500 hasn’t made a new high in 4 months already. This isn’t abnormal from a historical perspective. From Saturday’s study:
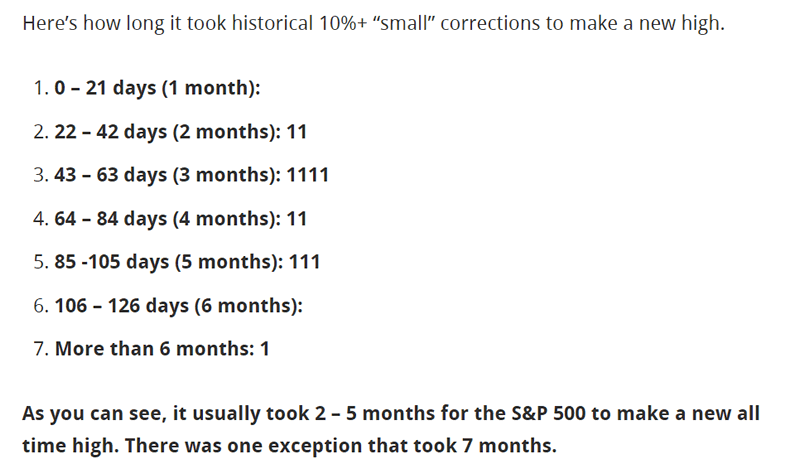
This study suggests that the stock market will make a new high before summer 2018 is over, as long as the economy continues to improve. The economy shows no signs of significant deterioration right now.
By Troy Bombardia
I’m Troy Bombardia, the author behind BullMarkets.co. I used to run a hedge fund, but closed it due to a major health scare. I am now enjoying life and simply investing/trading my own account. I focus on long term performance and ignore short term performance.
Copyright 2018 © Troy Bombardia - All Rights Reserved
Disclaimer: The above is a matter of opinion provided for general information purposes only and is not intended as investment advice. Information and analysis above are derived from sources and utilising methods believed to be reliable, but we cannot accept responsibility for any losses you may incur as a result of this analysis. Individuals should consult with their personal financial advisors.
© 2005-2022 http://www.MarketOracle.co.uk - The Market Oracle is a FREE Daily Financial Markets Analysis & Forecasting online publication.


