


A Purrrfect Gold Price Setup!
Commodities / Gold and Silver 2018 Jun 01, 2018 - 12:29 PM GMTBy: Peter_Degraaf

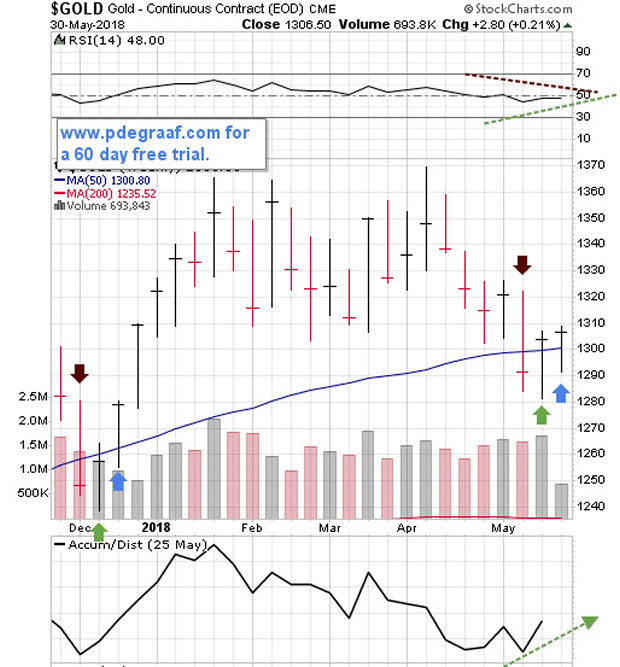
 Featured is the weekly gold chart. The green arrows point to ‘upside reversals’, developing after price dropped below the 50WMA. The blue arrows point to a positive follow-through, following an upside reversal. A similar situation back in December enabled gold to rise for 5 out of 6 weeks! The current rise has the potential to jump above the $1365 resistance area with a target at $1395. The RSI is neutral, but the A/D line is positive.
Charts courtesy Stockcharts.com
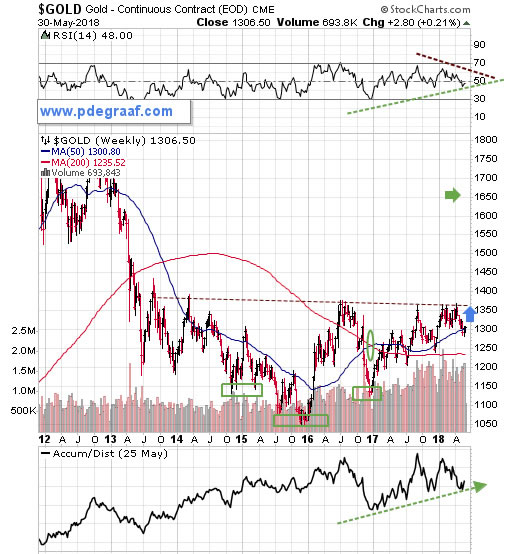
Featured is a longer-term gold chart. The pattern is a bullish inverted 'head and shoulders' formation (green blocks). A breakout at the blue arrow sets up a target at the green arrow. The RSI is at support and the A/D line is rising. The moving averages are in positive alignment (green oval), and the 50WMA (blue line) is rising.
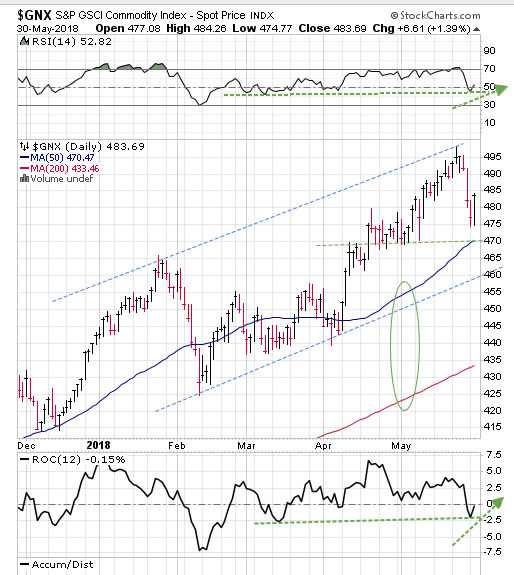
Featured is GNX the commodity index. Price is rising inside the blue channel. A short-term pullback from overbought conditions is coming to an end. The supporting indicators are ready to rise up from support levels. The moving averages are in positive alignment and rising, (green oval). This uptrend supports the entire commodity complex, including the precious metals sector.
Peter Degraaf is NOT responsible for your trading decisions. Please do your own due diligence.
By Peter Degraaf
Peter Degraaf is an on-line stock trader with over 50 years of investing experience. He issues a weekend report on the markets for his many subscribers. For a sample issue send him an E-mail at itiswell@cogeco.net , or visit his website at www.pdegraaf.com where you will find many long-term charts, as well as an interesting collection of Worthwhile Quotes that make for fascinating reading.
© 2018 Copyright Peter Degraaf - All Rights Reserved
DISCLAIMER:Please do your own due diligence. Investing involves taking risks. I am not responsible for your investment decisions.
Peter Degraaf Archive |
© 2005-2022 http://www.MarketOracle.co.uk - The Market Oracle is a FREE Daily Financial Markets Analysis & Forecasting online publication.