Unbelievable Analogy in Gold & Silver
Commodities / Gold and Silver Stocks 2018 Jun 04, 2018 - 06:20 PM GMTBy: P_Radomski_CFA
Gold moved lower in May and it’s also down in June, but the price action is far from being spectacular. The overall volatility is still very low and the situation in the precious metals sector is simply extremely boring. But with May now being over and with a new month, new factors are likely to come into play and the odds are that this month will be anything but boring. Especially, if we see the continuation in the analogy that practically nobody seems to realize.
Let’s move right to it and analyze the gold market from the long-term point of view.

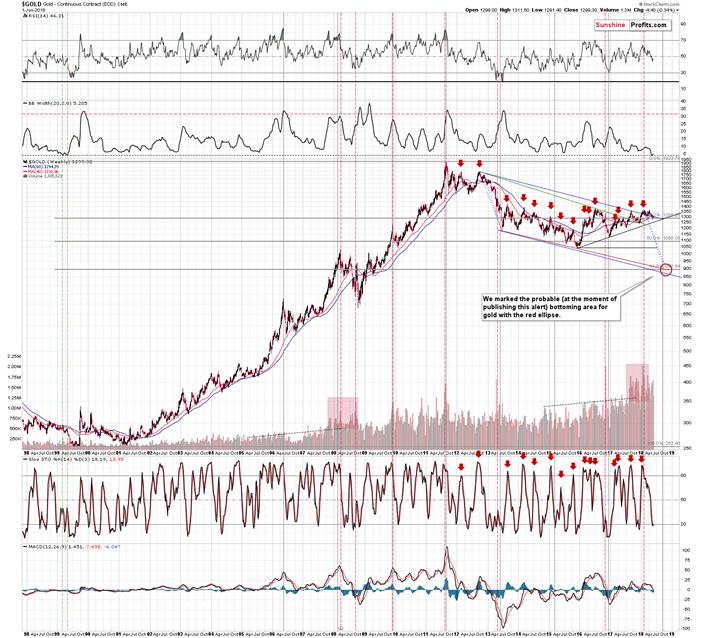
The second indicator from the top is the width of the Bollinger Band – a technical tool that can be used in a few ways and one of them checking when the bands are narrowing and viewing this as a sign of an upcoming huge move. Everyone heard the “calm before the storm” phrase and it is a perfect description of what the above technique tries to detect. It is designed to show if the market is currently too calm and it should make one suspicious as very calm and very volatile periods tend to be quite close to each other.
The Bollinger Band’s width is currently very small, which implies that a big move is just around the corner.
The above is just a general technique, so some may say that there’s no specific reason why it should work in gold at this particular time. The truth, however, is that there is not one but two specific reasons (or more depending on how one counts) why this technique should be taken into account and viewed as reliable.
The first confirmation is visible on the above chart and it’s the simple fact that this signal has already worked in case of the yellow metal – in 1999. We’ve seen the Bollband’s width as low as it was recently only one time in the past and it was followed by a big decline.
Even more importantly, it worked right before the final decline that ended a prolonged bear market and started a new bull market. Based on multiple other factors we had been expecting gold to slide one final time (below the 2015 lows) and then to move higher in the medium term. It is remarkable that the confirmation from the above technique suggests exactly that.
There may be some short-term implications as well. If you look closely, there were actually two times in 1999 when the Bollinger Band’s width was as low as it was recently. The first time triggered a decline and a smaller corrective upswing, which was then followed by another decline in the indicator and then the final slide.
We have recently seen a move lower in the width of the Bollinger Band along with a decline in gold and now we’re seeing a small corrective upswing in both of them. If the analogy to 1999 is to be upheld, this is the last stop before the final part of the bear market that started in 2011. In other words, the implications for the following weeks and months are very bearish.
On a side note, please keep in mind that the above chart includes our medium-term downside target for gold. The final bottom is likely to be seen in the final part of the year, likely in late September or early October and gold could move to about $900 (more precisely, $890) before the new bull market really starts.
All right, but that’s still just one confirmation…
What if we told you that the price of gold is not the only part of the precious metals sector that provides the above signal?
Enter silver.

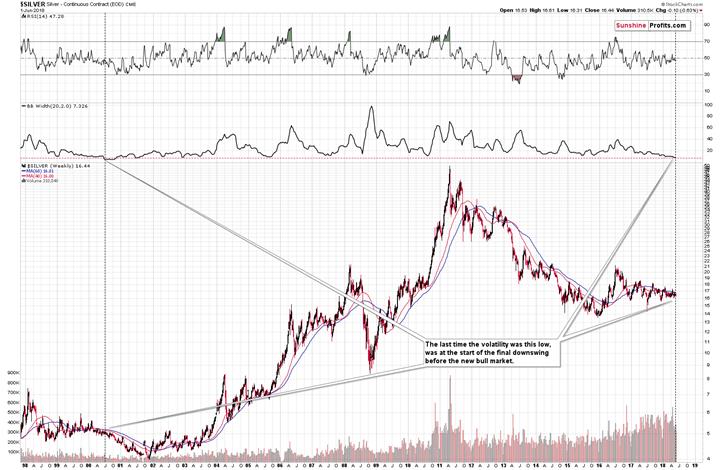
The situation in gold’s sister metal is analogous and serves as a perfect confirmation. There was only one situation which was similar to what we’ve seen in the past months and it’s what had happened before the final part of the previous bear market.
The situation is similar not only in the level of the Bollinger Band’s width, but also in case of the shape of the moves in both: indicator and silver price. As far as the latter is concerned, the 1998 top is very similar to the 2016 top (note the characteristic head-and-shoulders shape and silver’s position relative to both moving averages). In both cases the declines ended at the end of the year (1998 and 2016) and then silver started to move back and forth for about 1.5 years with several sharp rallies that didn’t last long. That’s exactly what happened in both cases and based on this analogy it seems that the back-and-forth movement is coming to an end.
What’s next? Back in 2000 and 2001, silver decline in a rather stable manner, but it may not be the case this time. The decline that we saw almost 20 years ago was preceded by about 10 years of back and forth movement around the $5 level, from which the decline started. Investors were not interested in the silver market and traders were unimpressed as well and the volume reflected it. Consequently, there was much less short-term capital that could have been added on the short side of the market, exacerbating the downswing.
The situation is very different today despite the similarity in the recent price moves. Silver has not been trading around the $16.50 for a decade, but for about 3 years and what we saw less than 10 years ago was a 2.5-year rally that took silver from below $9 to about $50. That was extremely exciting, and many people keep thinking that silver is about to take off immediately. The volume readings show that the interest in the silver market is many times bigger than it was about 20 years ago.
Besides, even during the last 1.5 years of back and forth trading, the very short-term moves in silver were much more volatile than the ones in 1999 and 2000. In particular, the early July 2017 overnight decline served as a proof that volatility in the white metal is to be expected.
What does it all mean? It means that the signal coming from the analysis of Bollinger Bands’ width is well confirmed and we should be preparing for lower gold and silver prices in the coming weeks.
But how do I know that the decline will really start this time? It’s been delayed for so long, so why shouldn’t it be delayed even longer?
That is a very good question to ask, and there is indeed no certainty (there is none in any market in general, though), but we have another indication that suggests that it’s high time for the decline to start.
Precious Metals and their True Seasonality
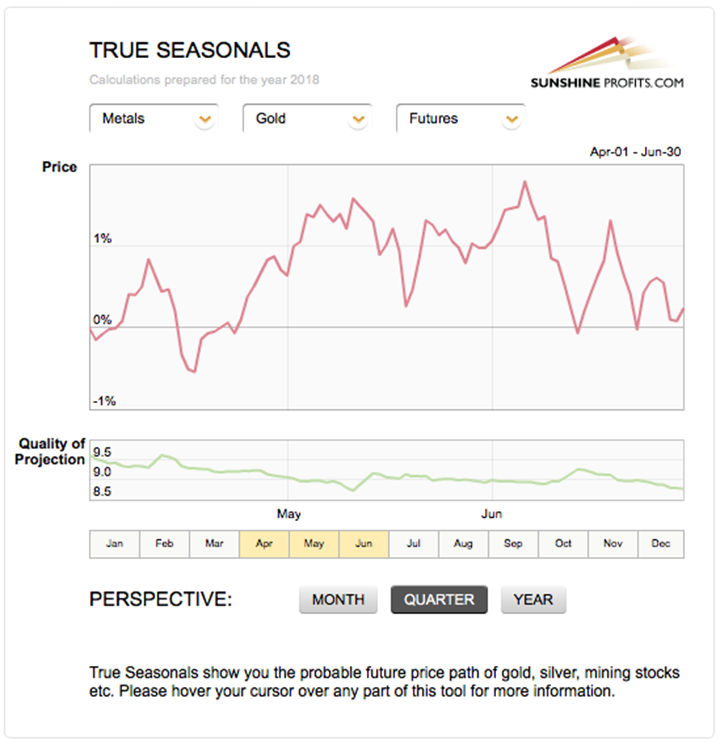
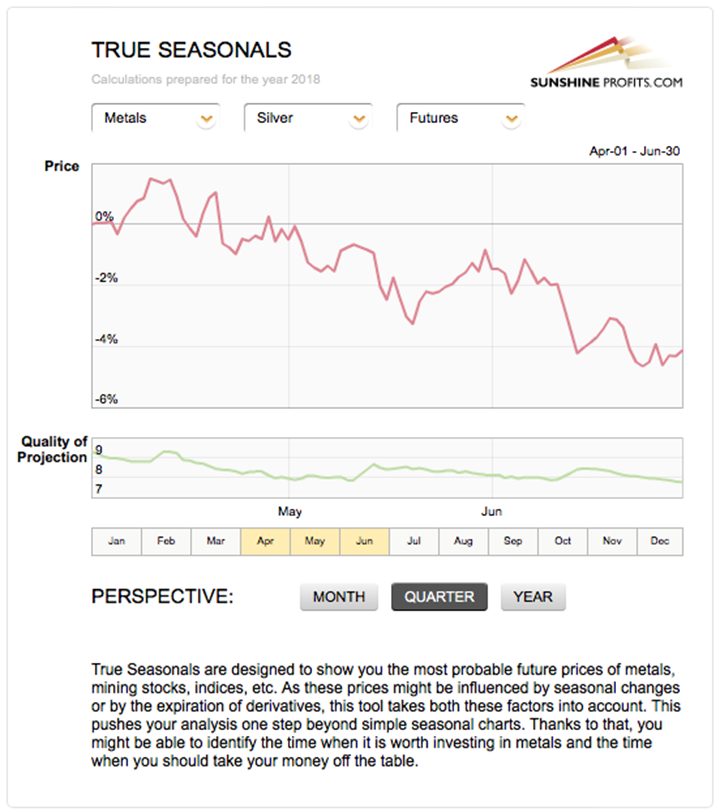
In short, it’s this time of the year during which one can expect gold and silver to slide, precisely because declines on average are often seen in early June. Even if we additionally take into account the effect of the expiration of derivatives (which is what True Seasonals do in addition to providing regular seasonality insights), we still get bearish implications for the near term.


If this June is going to be business as usual, then we can expect some back and forth trading in the first several days or even a small move higher, but then declines for the remaining part of the month. Given that we are publishing this analysis on June the 4th, most of this month’s regular bullish implications are already behind us and thus one shouldn’t count on more than a few days of strength – if we see them at all.
Let’s keep in mind that seasonality is not a crystal ball, but a “default” mode in which the market is likely to move if there are no other strong drivers present and in light of the long-term signals that we have in play right now along with silver’s apex-based reversal, it seems that the above gold and silver seasonal tendencies can be overridden and a more bearish outlook can prevail.
Summary
Summing up, it seems that the next huge downswing in the precious metals market is just around the corner and there are some short-term signs suggesting that it may even begin this week. The True Seasonality for gold and silver suggests that one should expect lower gold and silver prices this month, while silver’s apex-based turning point indicates that the decline may have already begun. The analogies to what happened in gold and silver when the market was as boring as it’s been recently suggest that if we get another very short-term and small move higher, it may be the final one before the move to the final bottom begins.
If you enjoyed the above analysis and would like to receive free follow-ups, we encourage you to sign up for our gold newsletter – it’s free and if you don’t like it, you can unsubscribe with just 2 clicks. If you sign up today, you’ll also get 7 days of free access to our premium daily Gold & Silver Trading Alerts. Sign up now.
Thank you.
Przemyslaw Radomski, CFA
Founder, Editor-in-chief
Tools for Effective Gold & Silver Investments - SunshineProfits.com
Tools für Effektives Gold- und Silber-Investment - SunshineProfits.DE
* * * * *
About Sunshine Profits
Sunshine Profits enables anyone to forecast market changes with a level of accuracy that was once only available to closed-door institutions. It provides free trial access to its best investment tools (including lists of best gold stocks and best silver stocks), proprietary gold & silver indicators, buy & sell signals, weekly newsletter, and more. Seeing is believing.
Disclaimer
All essays, research and information found above represent analyses and opinions of Przemyslaw Radomski, CFA and Sunshine Profits' associates only. As such, it may prove wrong and be a subject to change without notice. Opinions and analyses were based on data available to authors of respective essays at the time of writing. Although the information provided above is based on careful research and sources that are believed to be accurate, Przemyslaw Radomski, CFA and his associates do not guarantee the accuracy or thoroughness of the data or information reported. The opinions published above are neither an offer nor a recommendation to purchase or sell any securities. Mr. Radomski is not a Registered Securities Advisor. By reading Przemyslaw Radomski's, CFA reports you fully agree that he will not be held responsible or liable for any decisions you make regarding any information provided in these reports. Investing, trading and speculation in any financial markets may involve high risk of loss. Przemyslaw Radomski, CFA, Sunshine Profits' employees and affiliates as well as members of their families may have a short or long position in any securities, including those mentioned in any of the reports or essays, and may make additional purchases and/or sales of those securities without notice.
Przemyslaw Radomski Archive |
© 2005-2022 http://www.MarketOracle.co.uk - The Market Oracle is a FREE Daily Financial Markets Analysis & Forecasting online publication.


