


Gold’s Breakout vs. Relativity
Commodities / Gold and Silver 2018 Jun 06, 2018 - 06:37 PM GMTBy: P_Radomski_CFA

 Gold, silver, and mining stocks moved higher once again yesterday and the former even managed to move above the declining trend channel. Breakouts are bullish and thus the outlook for gold improved significantly… Or did it? Gold’s price in terms of the euro and gold’s relative performance to silver and mining stocks make replying to the above question quite easy. Looking at the relative price moves on a day-to-date basis doesn’t provide any interesting implications, but who says that it’s the only way in which one can examine them?
Let’s move right into the charts, starting with the gold chart.
Another Day, Another Breakout in Gold
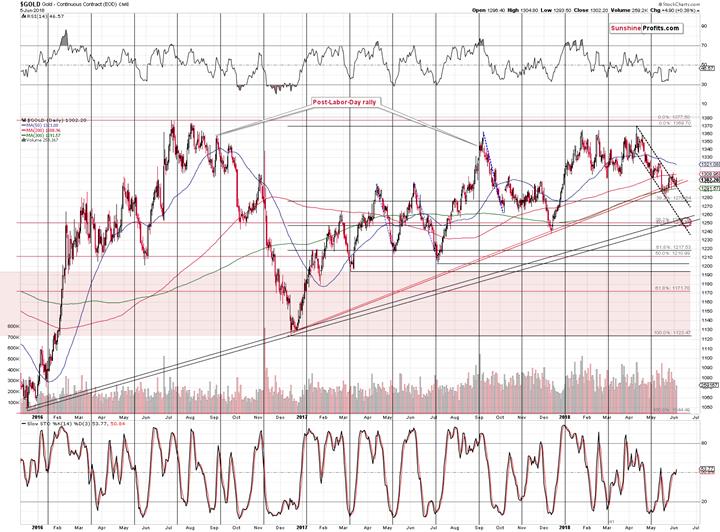
Yesterday’s upswing, as encouraging as it may have appeared, was nothing extraordinary. Yes, the price of gold moved above the upper border of the declining trend channel, but the same was the case just several days ago and the breakout was invalidated shortly as gold moved back below $1,290 shortly.
Breakouts need to be confirmed, before they can be viewed as important. If they are not, and are invalidated instead, they become bearish signs. We have just seen an example of this phenomenon in the gold market, and this should make us particularly suspicious to another attempt of gold to move above the declining resistance. This is especially the case since gold moved higher on low volume. Yesterday’s breakout did not represent a fierce battle between bears and bulls that was won by the latter. It was more of a pause during which both sides were hesitating. Consequently, there are no bullish implications of yesterday’s upswing in gold.
This is especially the case if we consider the situation in gold in terms of the euro.
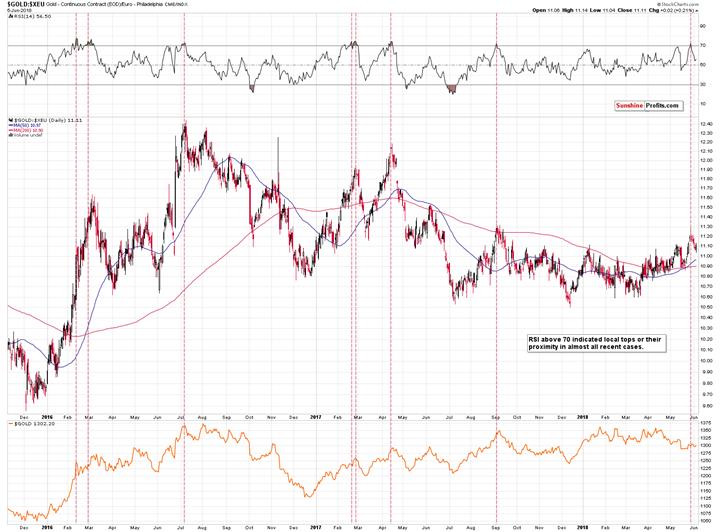
The RSI indicator based on this version of gold’s price has recently indicated a local top by moving above 70 and then back below it. With the exception of early 2016, this signal meant that a bigger decline was starting. We saw a small move higher since this signal became visible, but it’s not close to the sizes of the declines that we saw in analogous cases. Consequently, if history is to rhyme, we could expect gold to fall further in the short run.
Silver’s Subtle Outperformance
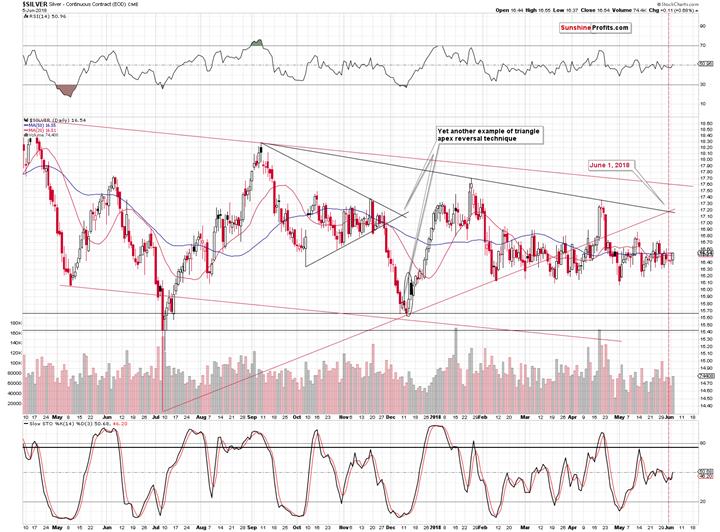
The size of the silver rally doesn’t seem significant at first sight, but the size of the volume in silver suggests that we may have seen something important. It’s not spectacular, but it is big if we compare it to the size of the volume in gold. The yellow metal moved higher on low volume, but what we see above is rather average. Could it be the case that the silver price action is somehow meaningful in relation to gold?
To answer this question, let’s take a look at the chart that features them both at the same time.
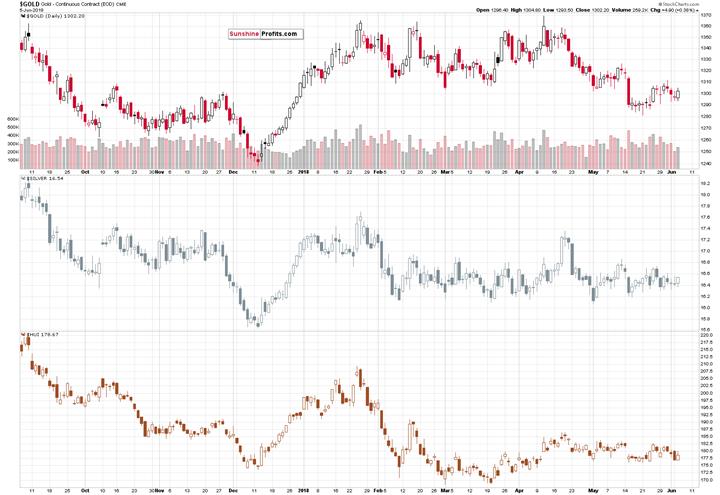
On a day-to-date basis, it may not appear significant, but if we consider the last 5 trading days, we’ll see that gold is lower than it was, gold stocks are lower than there were and that they underperformed gold, whereas silver is more or less where it was before.
This means that silver has indeed outperformed gold, while gold stocks underperformed. The signal is not as clear as if we had seen this kind of outperformance and underperformance on a single day, but it’s definitely meaningful.
As a reminder, silver’s outperformance and mining stocks’ underperformance is one of the gold and silver trading techniques that provides bearish signals right before declines.
This brings us to the analysis of mining stocks.
Miners’ Short- and Long-term Signals
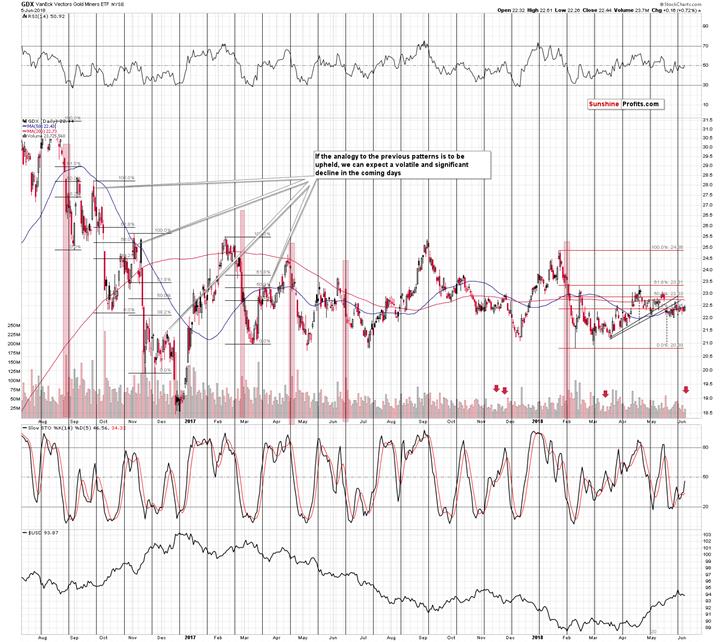
The volume that we saw yesterday was bigger than what we had seen on Monday, but it was still nothing to call home about. We can say the same thing about GDX’s rally of 16 cents. Mining stocks are moving back and forth and yesterday’s move was just a part of this pattern. Speaking of patterns, let’s not forget that miners have tested the mid-February high a few times and this means that they can now slide much lower. In other words, our Monday’s comments remain up-to-date:
After each short-term downswing that was particularly volatile, GDX moved back up a few times before the decline continued. The early 2018 decline was definitely very volatile, so we shouldn’t be surprised to see this kind of consolidation. It’s longer than the previous ones, but in terms of the prices that were reached, the 2016 price moves and the 2018 ones seem quite similar. The implication here is that once mining stocks break below their previous 2018 low, the following slide is likely to be volatile, just like the declines in 2016 were. In the light of the above, one might expect GDX to reach its late 2016 lows after such breakdown.
On a more short-term note, please note that mining stocks were also trying to break above the rising resistance line based on the March and early May lows, which is also the neck level of the bearish head-and-shoulders formation. Since there was no invalidation, the implications of this formation remain in place. Namely, GDX is likely to move at least to the mid-February 2018 lows rather sooner than later.
All in all, the short-term outlook for the precious metals mining stocks is bearish and it seems that it may become even more bearish later this month, after GDX breaks to the new 2018 lows.
As far as the big picture is concerned, the key thing to keep in mind about mining stocks is that they are after two major breakouts with regard to their performance vs. gold and vs. other stocks.
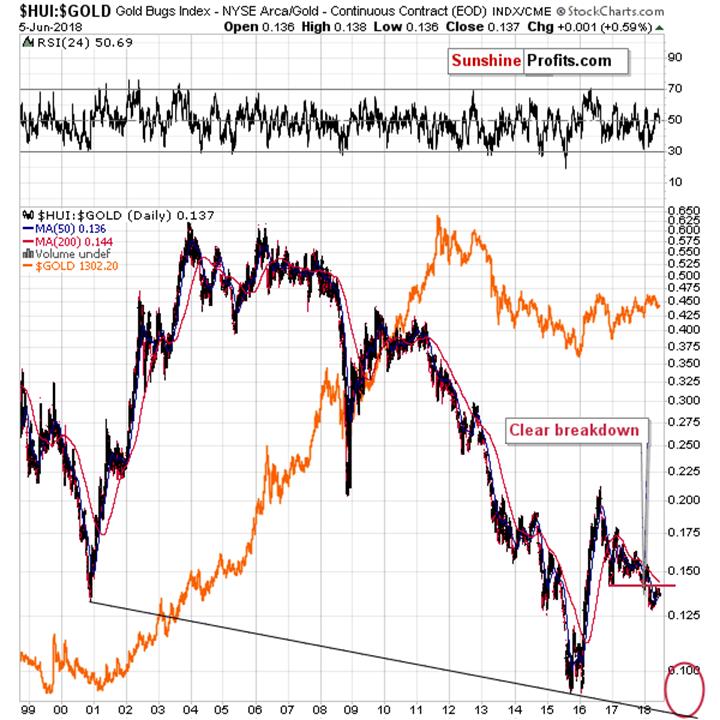
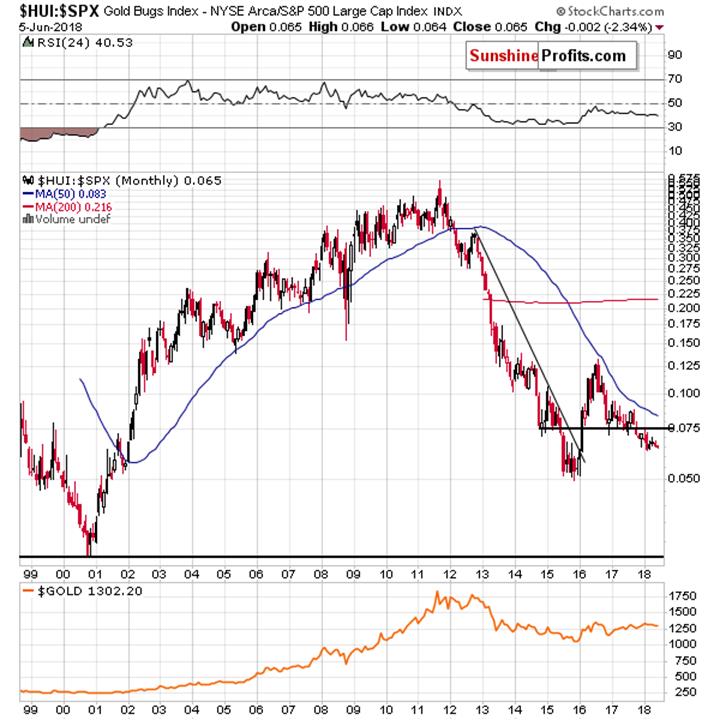
As you can see on the above charts, both key gold stock ratios are after major, long-term breakdowns. Both moves were also confirmed, which means that they were not accidental and the implications should be considered important. The moves were not only confirmed in terms of time and by a move back to the previously broken level (in the case of the HUI to gold ratio on the upper chart) – the moves actually confirm each other. If it was just one of the ratios providing this kind of signals, its strength would be limited, but since both of them point to the same – bearish – outlook, it’s something that one needs to keep in mind.
Summary
Summing up, while the precious metals market is boring on a day-to-day basis and nothing seems to be going on, if we consider a slightly broader timeframe, we see that the signals are pointing to lower prices in the coming weeks, which is in tune with the current True Seasonal patterns. Moreover, let’s keep in mind that the analogies to what happened in gold and silver when the market was just as boring as it’s been recently suggest that if we get another very short-term and small move higher, it may be the final one before the move to the final bottom begins. The outlook for the precious metals sector remains bearish.
Please note that the above is based on the data that was available when this essay was published, and we might change our views on the market in the following weeks. If you’d like to stay updated on our thoughts on the precious metals market, please subscribe to our Gold & Silver Trading Alerts.
Thank you.
Przemyslaw Radomski, CFA
Founder, Editor-in-chief
Tools for Effective Gold & Silver Investments - SunshineProfits.com
Tools für Effektives Gold- und Silber-Investment - SunshineProfits.DE
* * * * *
About Sunshine Profits
Sunshine Profits enables anyone to forecast market changes with a level of accuracy that was once only available to closed-door institutions. It provides free trial access to its best investment tools (including lists of best gold stocks and best silver stocks), proprietary gold & silver indicators, buy & sell signals, weekly newsletter, and more. Seeing is believing.
Disclaimer
All essays, research and information found above represent analyses and opinions of Przemyslaw Radomski, CFA and Sunshine Profits' associates only. As such, it may prove wrong and be a subject to change without notice. Opinions and analyses were based on data available to authors of respective essays at the time of writing. Although the information provided above is based on careful research and sources that are believed to be accurate, Przemyslaw Radomski, CFA and his associates do not guarantee the accuracy or thoroughness of the data or information reported. The opinions published above are neither an offer nor a recommendation to purchase or sell any securities. Mr. Radomski is not a Registered Securities Advisor. By reading Przemyslaw Radomski's, CFA reports you fully agree that he will not be held responsible or liable for any decisions you make regarding any information provided in these reports. Investing, trading and speculation in any financial markets may involve high risk of loss. Przemyslaw Radomski, CFA, Sunshine Profits' employees and affiliates as well as members of their families may have a short or long position in any securities, including those mentioned in any of the reports or essays, and may make additional purchases and/or sales of those securities without notice.
Przemyslaw Radomski Archive |
© 2005-2022 http://www.MarketOracle.co.uk - The Market Oracle is a FREE Daily Financial Markets Analysis & Forecasting online publication.