Yield Curve Continues to Flatten. A Bullish Sign for the Stock Market
Stock-Markets / Stock Markets 2018 Jun 14, 2018 - 02:09 PM GMTBy: Troy_Bombardia
 The Treasury yield curve continues to flatten. The 10 year yield – 2 year yield is now at 0.39%. Or as the bears would have you believe, “the Fed is about to end the economy and stock market”.
Facts and data disagree.
This is the first time in the current economic expansion cycle in which the yield curve flattened to 40 basis points (0.4%). As you can see, the yield curve still needs to flatten a lot more before a recession and bear market begins.
The yield curve needs to invert (i.e. 10 year – 2 year yield is below zero) before you get a bearish sign.
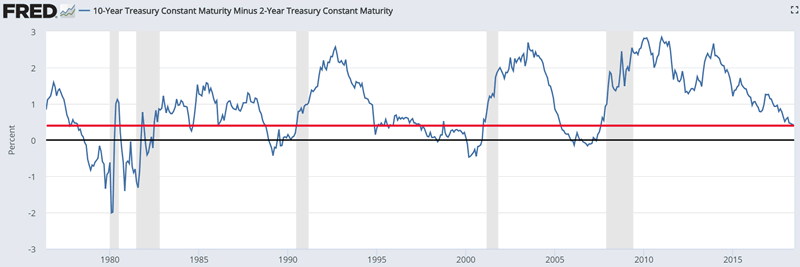
Here’s the data to prove it.
Here’s what happens next to the S&P 500 when yield curve reaches 0.4% for the first time in each economic expansion cycle.
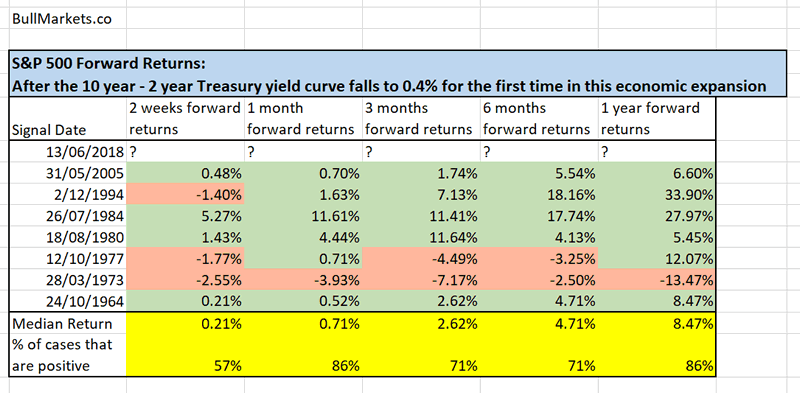
Click here to download the data in Excel.
Let’s look at the historical cases in detail.
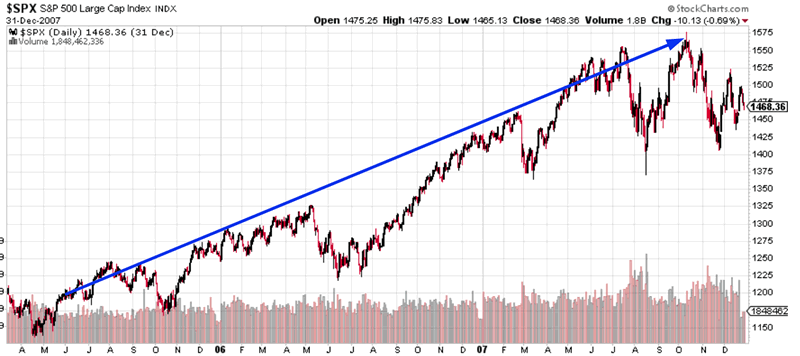
May 31, 2005
The stock market rallied higher over the next 2 years after the yield curve flattened to 40 basis points.
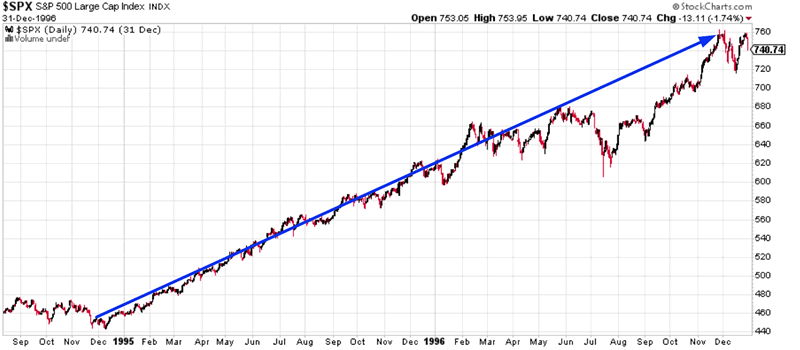
December 2, 1994
The stock market rallied higher over the next few years after the yield curve flattened to 40 basis points.
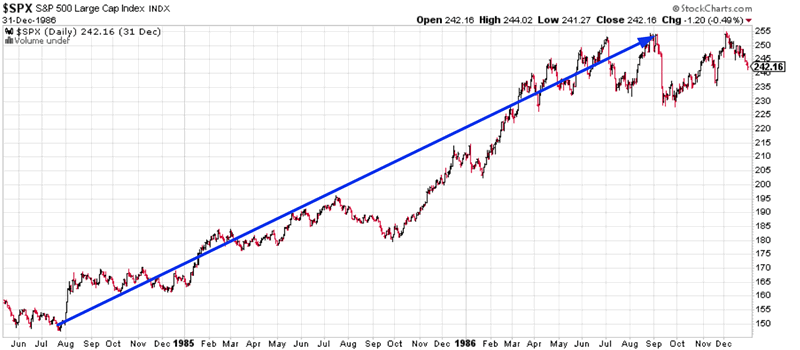
July 26, 1984
The stock market immediately started to rally after the yield curve flattened to 40 basis points.
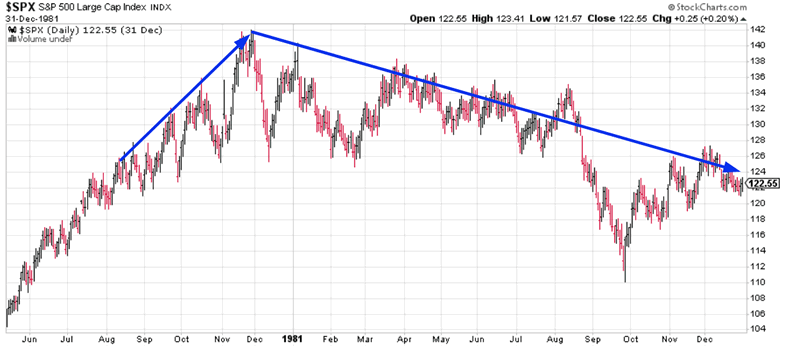
August 18, 1980
The stock market rallied for 3 more months after the yield curve flattened to 40 basis points.
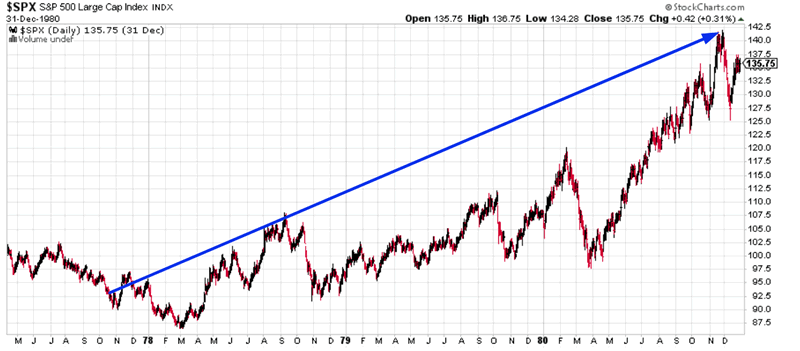
October 12, 1977
The stock market fell a little more after the yield curve flattened to 40 basis points, but then it surged.
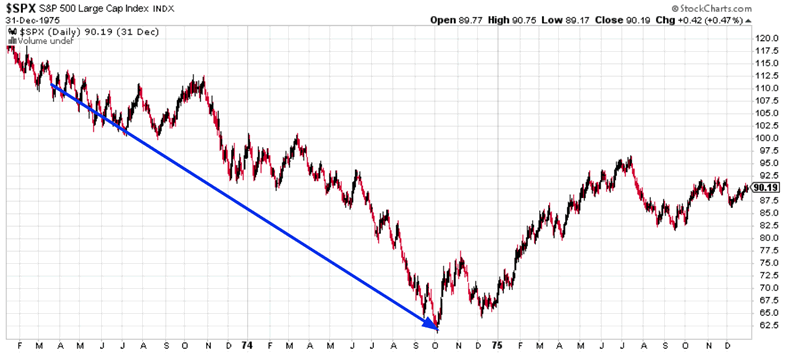
March 28, 1973
The stock market was already in a bear market when the yield curve flattened to 40 basis points.
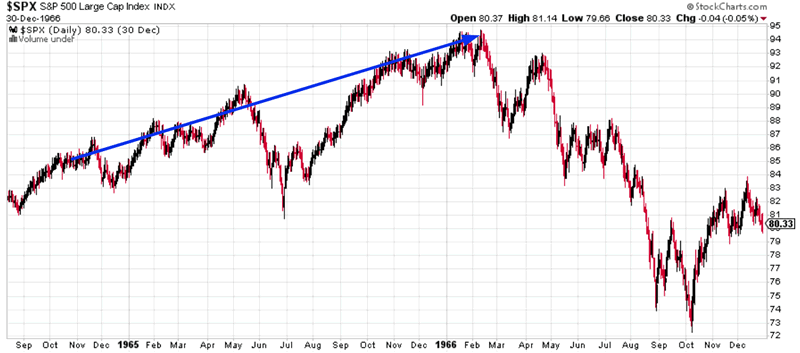
October 24, 1964
The stock market rallied for more than a year after the yield curve flattened to 40 basis points.
Conclusion
As you can see, the yield curve is still sending a medium-long term bullish sign for the stock market. It says that:
- The stock market will probably trend higher for another year or two, after which…
- The yield curve will invert and an equities bear market will start.
There is only 1 bearish case: 1973. That bear market case was caused by OPEC’s oil embargo, which completely froze the U.S. economy and led to a sharp recession. A repeat of that historical scenario is unlikely today. The U.S. is increasingly energy independent, which means that the U.S. economy and stock market isn’t particularly beholden to foreign interests.
All the other cases are bullish.
Click here for more market studies.
By Troy Bombardia
I’m Troy Bombardia, the author behind BullMarkets.co. I used to run a hedge fund, but closed it due to a major health scare. I am now enjoying life and simply investing/trading my own account. I focus on long term performance and ignore short term performance.
Copyright 2018 © Troy Bombardia - All Rights Reserved
Disclaimer: The above is a matter of opinion provided for general information purposes only and is not intended as investment advice. Information and analysis above are derived from sources and utilising methods believed to be reliable, but we cannot accept responsibility for any losses you may incur as a result of this analysis. Individuals should consult with their personal financial advisors.
© 2005-2022 http://www.MarketOracle.co.uk - The Market Oracle is a FREE Daily Financial Markets Analysis & Forecasting online publication.


