Gold GLD ETF Update… Breakdown ?
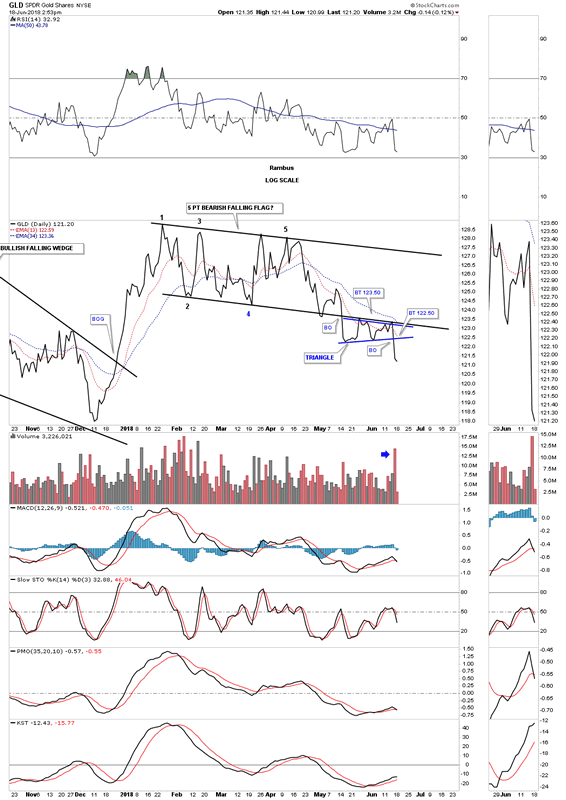
Commodities / Gold and Silver 2018 Jun 20, 2018 - 07:15 AM GMTJust a quick update on a few of the GLD charts we’ve been following closely. Below is the daily line chat which shows the breakout from the blue triangle that formed as the backtest to the larger 5 point bearish falling wedge reversal pattern. The bulls tried as hard as they could but they couldn’t take out the bottom rail of the falling wedge reversal pattern. Friday’s decline was on heavy volume.

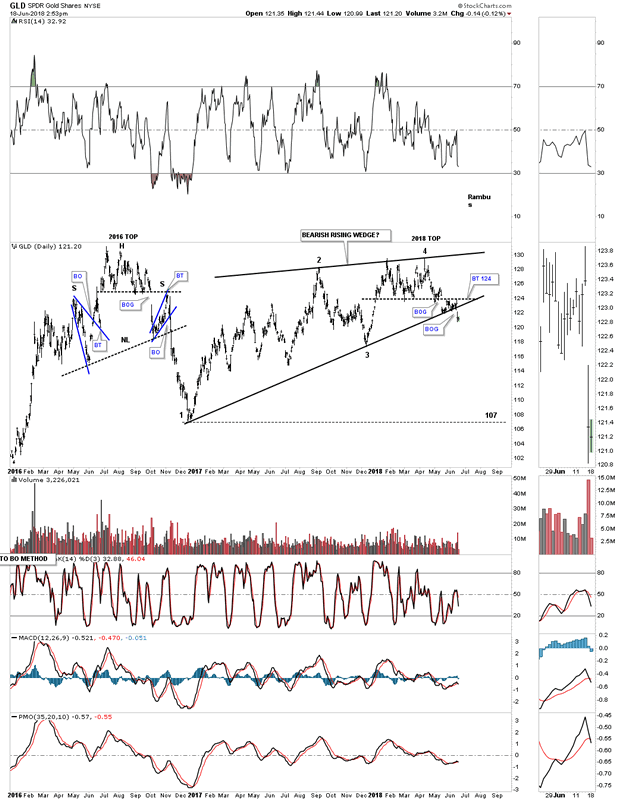
We’ve been following the ping pong move between the bottom rail of the bearish rising wedge and the top rail of the 2018 rectangle reversal top. Friday the price action gapped below the bottom rail of the falling wedge on heavy volume. Note how similar the 2018 top is to the 2016 top which produced a move down to the 107 area after a strong backtest.

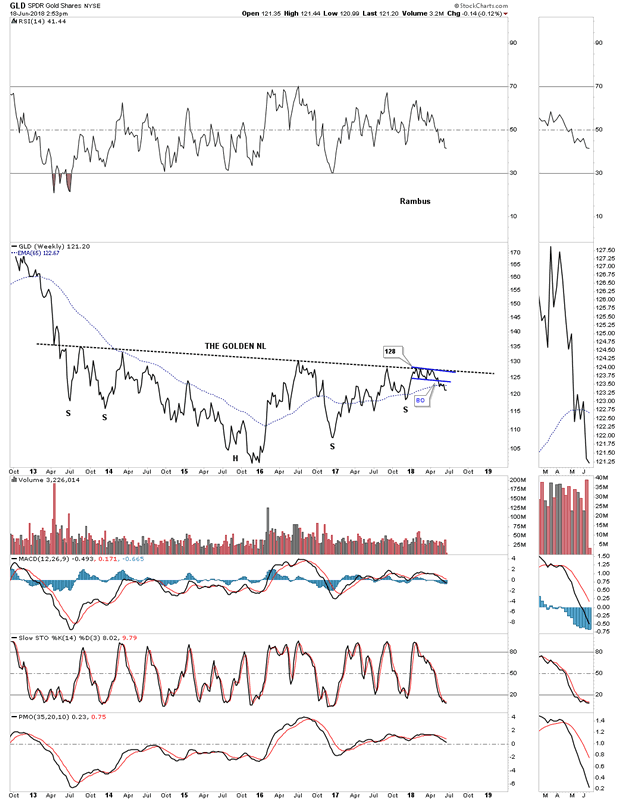
The weekly chart show the breakout from the bottom rail of the 2 1/2 year triangle consolidation pattern. A backtest would come in around the 123 area.

Until the golden neckline is broken to the upside the bears are still in charge.

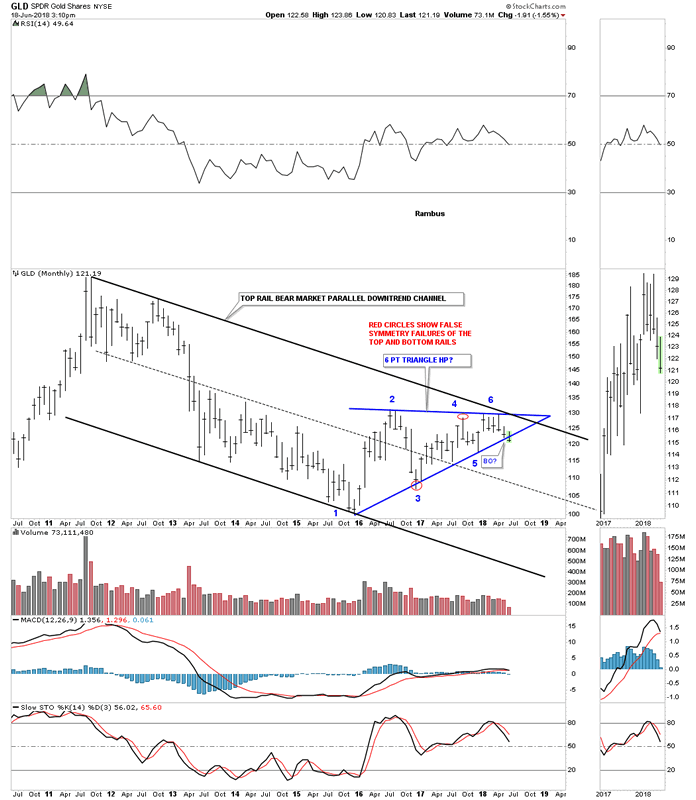
Below is the long term monthly chart which shows GLD’s bear market downtrend channel. Was last Friday’s move down the beginning of the next impulse leg down?

All the best
Gary (for Rambus Chartology)
FREE TRIAL - http://rambus1.com/?page_id=10
© 2018 Copyright Rambus- All Rights Reserved
Disclaimer: The above is a matter of opinion provided for general information purposes only and is not intended as investment advice. Information and analysis above are derived from sources and utilising methods believed to be reliable, but we cannot accept responsibility for any losses you may incur as a result of this analysis. Individuals should consult with their personal financial advisors.
© 2005-2022 http://www.MarketOracle.co.uk - The Market Oracle is a FREE Daily Financial Markets Analysis & Forecasting online publication.


