The NASDAQ’s Outperformance vs. the Dow is Very Bullish
Stock-Markets / Stock Markets 2018 Jun 21, 2018 - 12:57 PM GMTBy: Troy_Bombardia
First of all I’d like to thank Shawn. He raised a good question, one that I’ll answer in this study.
img src="/images/2018/June/21-shawn-question.png" width="800" height="388">
Here’s my answer.
As you probably already know, the NASDAQ has significantly outperformed the Dow year-to-date. This has got some market timers worried of a “bubble” in tech and FANG stocks (Facebook, Amazon, Netflix, Google).
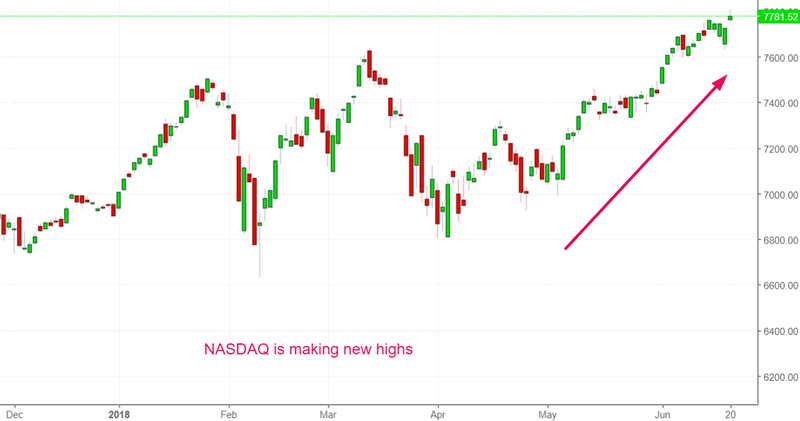
The NASDAQ’s Outperformance vs. the Dow is Very Bullish
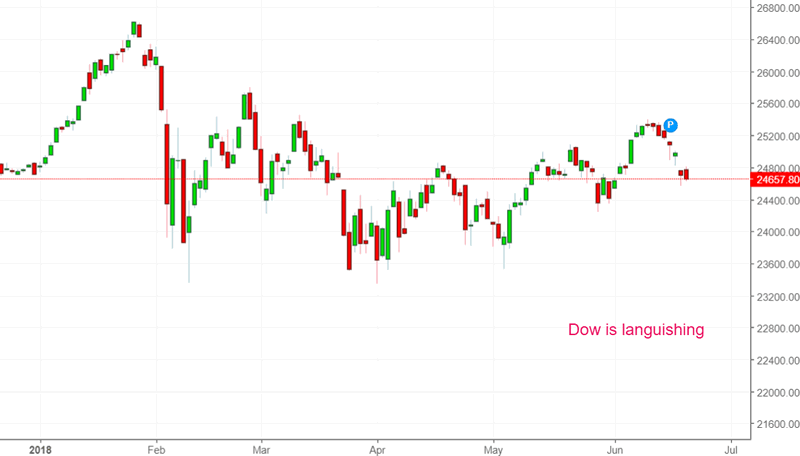
Part of this outperformance is understandable.
- Tech companies (particularly software companies) aren’t that exposed to China. Facebook, Netflix, and Google are already banned from China. And as software companies, they don’t face the same global supply chain risks that the large cap Dow stocks do.
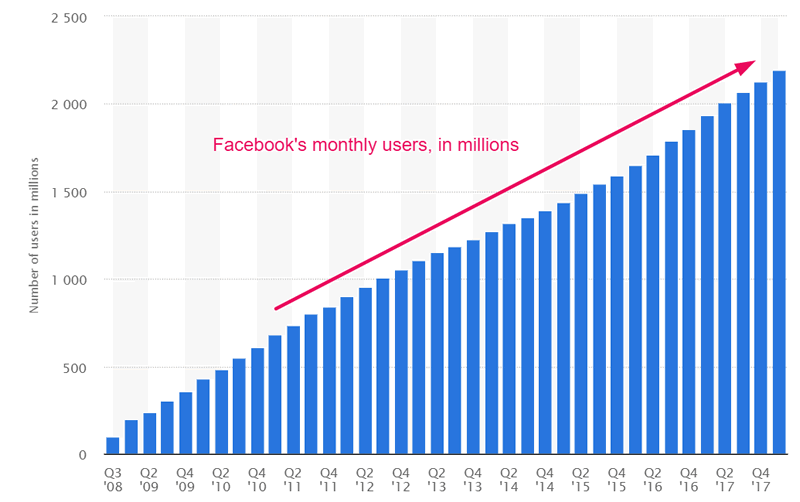
- Tech’s earnings growth is on fire.
Some people are surprised by tech’s strong earnings growth. I’m not. Despite their massive size, tech companies are absolutely crushing it in terms of growth.
So to answer Shawn’s question, how normal is the divergence between the NASDAQ and Dow?
This chart illustrates the NASDAQ:Dow ratio.
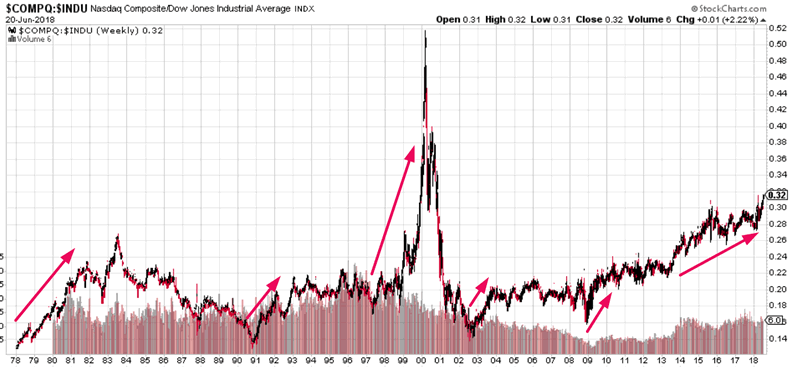
As you can see, the NASDAQ tends to outperform the Dow during:
- The early stages of an economic expansion.
- And the late stages of an economic expansion.
We’re clearly not in the early stages of this economic expansion, which by default suggests that we are in the late stages of this economic expansion.
And since the stock market and economy move in the same direction in the medium-long term, the stock market must also be in the late stages of its bull market. (This is similar to the conclusion we reached in Study: what happens next when tech outperforms utilities and consumer staples).
So here’s today’s study.
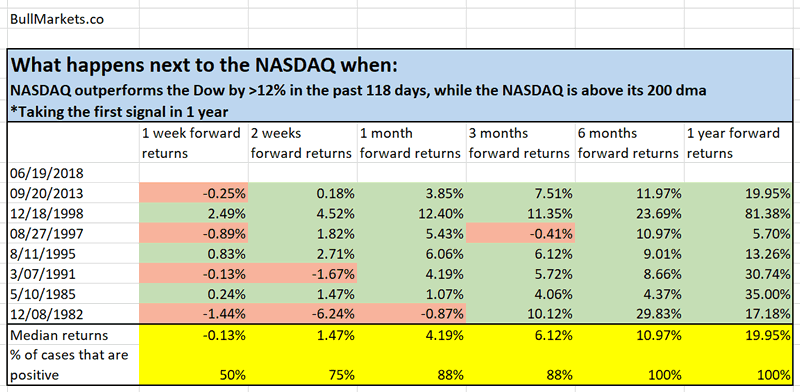
What happens next to the NASDAQ when:
The NASDAQ outperforms by Dow by at least 12% in the past 118 days (approximately 5.5 months) while the NASDAQ is still above its 200 daily moving average.
*We’re looking at cases in which this is the first signal in 1 year.
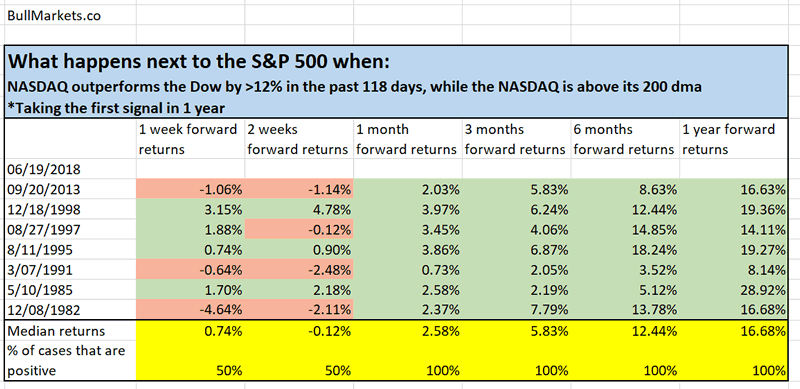
Here’s what happens next to the S&P when:
The NASDAQ outperforms by Dow by at least 12% in the past 118 days (approximately 5.5 months) while the NASDAQ is still above its 200 daily moving average.
*We’re looking at cases in which this is the first signal in 1 year.
Click here to download the data in Excel.
This study basically just looks at what happens next when the NASDAQ massively outperforms the Dow for the first time in a long time, while being in an uptrend.
Conclusion
The NASDAQ has just started to massively outperform the Dow. When this happens:
- The NASDAQ usually continues to soar. Yes, a bubble is coming. It’s the permabears job to bemoan the bubble. It’s your job to profit from it
- The stock market goes up pretty much every time in the next 6-12 months.
Based on several recent market studies, we can see why the stock market is about to melt-up in the next 12 months.
By Troy Bombardia
I’m Troy Bombardia, the author behind BullMarkets.co. I used to run a hedge fund, but closed it due to a major health scare. I am now enjoying life and simply investing/trading my own account. I focus on long term performance and ignore short term performance.
Copyright 2018 © Troy Bombardia - All Rights Reserved
Disclaimer: The above is a matter of opinion provided for general information purposes only and is not intended as investment advice. Information and analysis above are derived from sources and utilising methods believed to be reliable, but we cannot accept responsibility for any losses you may incur as a result of this analysis. Individuals should consult with their personal financial advisors.
© 2005-2022 http://www.MarketOracle.co.uk - The Market Oracle is a FREE Daily Financial Markets Analysis & Forecasting online publication.


