


State of the Markets… Gameplan for Transition from Bull to Bear
Stock-Markets / Financial Markets 2018 Jun 26, 2018 - 10:07 AM GMTBy: Plunger

 First off, I would like to thank Rambus for allowing me the intellectual freedom to deliver to you the straight story as I see it. Our views are not always in sync but I will tell you he has not ever tried to spin my views. I understand I write here as a privilege and am presenting my honest opinion, with no ulterior motives. We just want to get these markets right and make money…Thanks Rambus.
This weekend I would like to review the main features characterizing the markets which I have chronicled over the past 6 months. Often times “less is more” so I will keep my remarks condensed and focus on the overall stock market and the precious metals.
This past week I have emphasized that the stock market is in a state of high risk. This is because valuations are sky high in all asset classes and I see the elements of a broad top in the market which will likely prove to be the end of this 9 year bull market. That’s not saying the market falls hard anytime soon, but the process of a top has begun and is ongoing. Stated differently, we are likely in Phase I of a bear market and once Phase II arrives it may prove to be devastating and adversely impact an entire nation of investors.
Systemic Collapse
That’s what we actually had in 2008 with the derivative implosion which led to the deep plunge of that year. So what is required to have a systemic collapse? What are the prerequisites?
To have a systemic collapse there must be a large, broad error right out in plain sight which the masses don’t see. It must be a deeply held belief that is wrong. It must be big enough that it causes the misprizing of assets. We had this in 2007. What was the myth then? What was the deeply held belief that allowed the misprizing of assets? It was the firmly held belief that housing prices could never fall on a nationwide basis. Even Ben Bernanke stated this myth specifically.
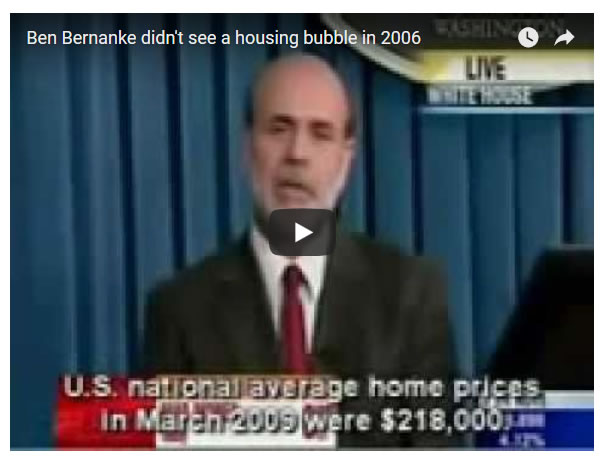
Trouble is the man is a crank. Once prices fell derivatives transmitted the shock into the core of the system. The myth was false.
Today’s Myth
So could we possibly have a similar myth, deeply held throughout the population causing asset prices to be misprized today? A myth in plain sight, yet few care to even see it? Making them so blind to the reality that it causes a total misprizing of assets. I believe that myth today is the belief that central banks are infallible. The belief that markets can be rescued and undergirded by the words and policies of central banks. It explains why young couples in Seattle are willing to commit millions of dollars that they don’t have into the purchase of an inflated home. This despite a collapse in these assets less than 10 years ago. This very act is a manifestation of this myth.
But here is the fundamental flaw of QE: by keeping rates submerged for 7 years, markets were not allowed to price risk. Therefore, investment decisions could be made without reference to RISK. The depth of this mistake is much larger than the housing bubble ever was, so when the myth is revealed to be false the correction of the myth will play out as a profoundly deep bear market.
Transition from Bull to Bear
Let’s review some of the bullet points of the process we have been witnessing over the past year.
- Three complete phases of a bull market from 2009-2018. This market was driven by QE, but it nevertheless underwent three well delineated phases. It is very typical that phase I & III do not have any secondary reactions. This indeed did not occur in phase I & III. Phase II however underwent 3-4 SRs, typical of major bull markets.
- Phase III unfolded according to script. It underwent a relentless advance without any significant pullbacks in its 15 month duration. Its last 2 months were characterized by a buyers capitulation where all caution was abandoned as buyers pilled in and the market blew out to the upside.
- The Throwover: As in most mania bull markets it experienced a throwover above the upside trend channel in its terminal phase. Note the extreme reading in RSI of 92. This incidentally was the highest RSI in the 120 year history of the averages…simply breathtaking.
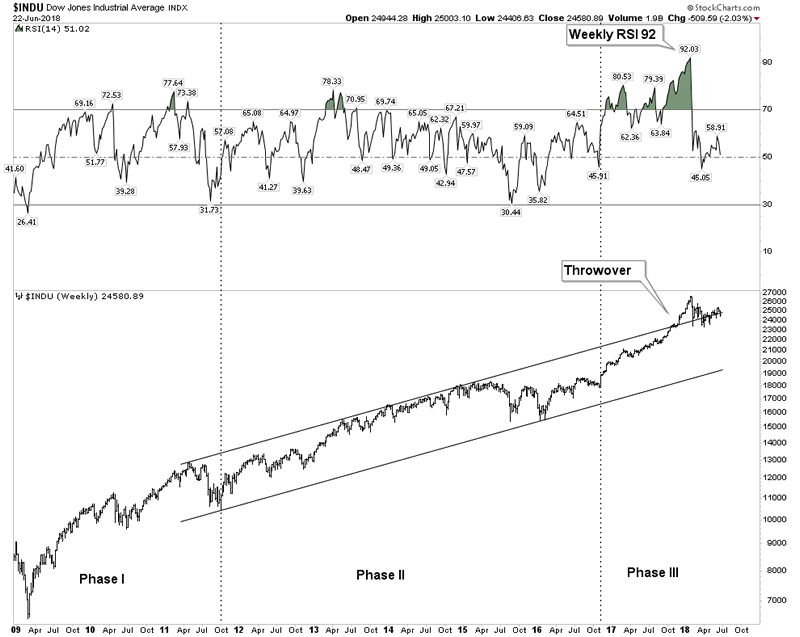
4. End of year top. This market saw a top in the end of year period, typical of many other famous bull markets.
5. Bitcoin Blowout. Bitcoin served as the object of fancy or the cherry on top of the everything bubble. This fits the bill for a speculative object at the top often seen at the peak of a mania bull.
Slaughter of the Vols
The initial takedown in late January-early February was focused on the most egregious area of speculation which was the volatility traders. This entailed short term total annihilation. Since then, the market has been attempting to recover its old highs. I have detailed this process on many occasions, we still sit in no mans land. According to DOW Theory we are inside a Secondary Reaction. A bear market signal only comes if both averages violate the SR lows indicated by the red line, but the bull is only revalidated when both averages go onto new highs.
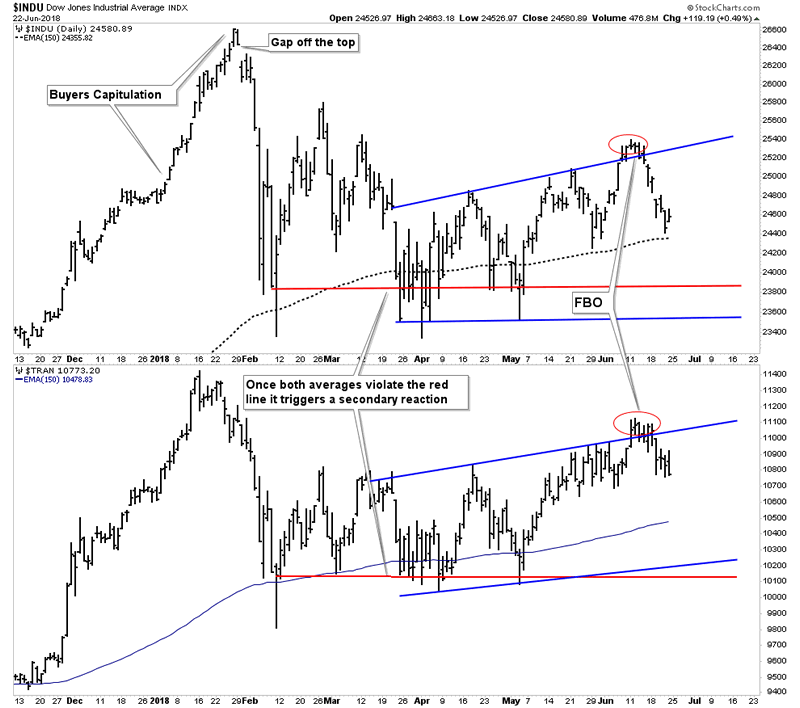
My interpretation of the above chart is the blue channel is a bear flag containing the consolidation of the drop from the highs in JAN/FEB. In order for the bull market to be revalidated BOTH averages must go onto new highs. In the mean time we have seen the RUT and QQQ (small caps & tech) go on to new highs. For now I interpret this as non-confirmation of the bull’s recovery. In Mr. Markets sick way it also serves to keep investors in the market as the internal action deteriorates. I emphasize, I don’t “know” what’s going to happen. If the averages all go on to new highs this analysis will have been proven wrong, I am simply describing the process in real time as I see it.
The “Right” Strategy according to Plunger
As mentioned, I believe we are in the early stage of a bear market that cannot yet be officially categorized as such. So what’s the right strategy? Let’s go back and look at the past 2 cycles. If you suspected this to be occurring back in 1999 (I did, it drove me nuts) the best thing to have done would have been to move to the sidelines. If you shorted it you got killed for the next year. Same thing occurred in 2007 and the best strategy would be to go to the sidelines and wait for the bear signal. In the movie, The Big Short, we see how the eventual winners suffered greatly waiting to finally be right. You don’t want to do this.
So my advice is to start moving large chunks to the sidelines and build cash. I am not selling my long term holds such as Altius because they are antifragile companies (read the book Antifragile, N. Taleb) I am selling fringe resource stocks, but keeping most of the portfolio.
Question: Plunger, if this is a bear market, the FED has our back right? It may take them a while to formulate a policy response, but eventually they will turn it around like they did in 2008/9. Within a year we will be back on track and back in the game…right?
Answer: I see you have not been listening, go back and re-read the section above about the FEDs powers being a myth. I think once the myth is revealed as false the FED will be unable to conduct its serial bubble operation to reinflate the economy. They have done it two times now intentionally creating a bubble in order to jack the economy up. It worked in a sense that they were able to create another bubble, however this one goes to the heart of money and credit. When the myth is gone their tools will be broken.
Question: That sounds scary, how bad could it get?
Answer: So you really want to know? OK then, gird yourself. First off it was Sir Issac Newton who said for every action there is an equal and opposite reaction. So the extent of the excess is proportionate to the ultimate correction. That’s what the 89% decline from 1929-1932 was all about. I understand we had a sound money system back then and not a fiat money system, but you should stop thinking in only nominal terms. We could have those kinds of numbers, but maybe not in nominal terms, in real terms instead. The excesses in this cycle are so huge it’s hard to get your head around them.
If you want to try getting your head around it I suggest reading the book “The Everything Bubble” by Graham Summers. It is written for the average guy and is an easy read in simple terms. Graham really grasps what has gone on over the past 40 years to the extent of how the bubble has been blown to vast excess.
In the next bear market, I would not count on the FED being able to just blow another bubble and use it to come to the rescue like they have in the past 2 exercises.
Question: So then what comes next?
Answer: The Post Bubble Contraction (PBC)
Post Bubble Contraction-Breeding Ground for the Gold Stock Bull Market
It shouldn’t be necessary to explain the PBC, as it has been chronicled extensively before. We have seen a few cyclical gold stock bull markets, but we haven’t seen a PBC driven bull market in the gold stocks since the 1930’s. They only come around every 50-70 years, but that’s the time you want to be “all in”.
Take a walking tour of San Francisco’s Knob Hill
If you want to see the remnants of a PBC bull market in gold and silver, when in San Francisco take a walk up to the top of Knob Hill where you will see the Pacific-Union Club building. Trust me you are not going to be invited in as it is reserved for the most exclusive innermost of circles of industrial America. The Mansion sits on top of the hill and was not destroyed by the 1906 fire.
http://en.wikipedia.org/wiki/Pacific-Union_Club#/media/File:2009-0723-CA-PacificUnionClub.jpg
This mansion was built by James Clair Flood. Who was he? A stock broker who became a silver baron. That’s right the most prominent home in all of San Francisco owned by a precious metals guy. Let this sink in for a while as it shows the prominent role the metals can play in a post bubble contraction. Enough wealth was created to rise to the literal top of San Francisco society.
http://en.wikipedia.org/wiki/Pacific-Union_Club
Timeline of the PBC
In the past the PM stocks have initially declined in sympathy with the stock market. Once this process is over the bull market has unfolded. In 2008 this period only lasted 2 months. One can only speculate if this occurs this time around. But the PBC typically lasts 15 years or so. Within that time window expect several cyclical bull and bear markets within the context of a secular bull market.
State of The Gold Market
It was a rough week for gold. It got blasted down $40 over the past 2 weeks. No doubt investors are rattled and profoundly discouraged.
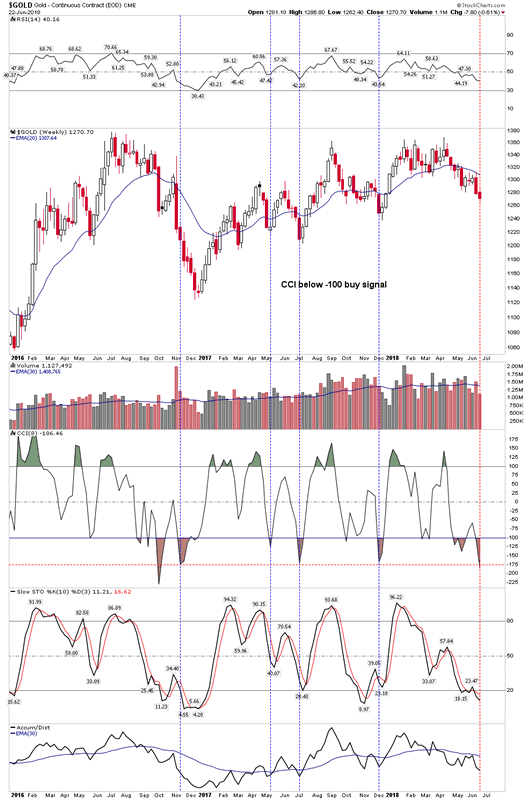
I would like to make the case that viewed from longer duration charts it’s really not that bad. Many juniors have taken good sized hits, however overall the stocks have held up fairly well. The chart above argues for a bottom.
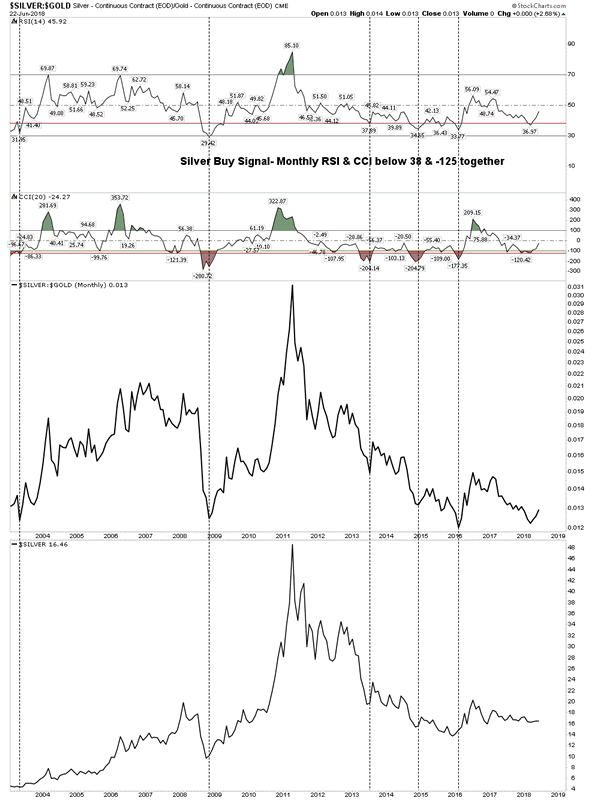
Below the Silver buy signal indicator continues to look positive. Keep in mind these are broad turn indicators:
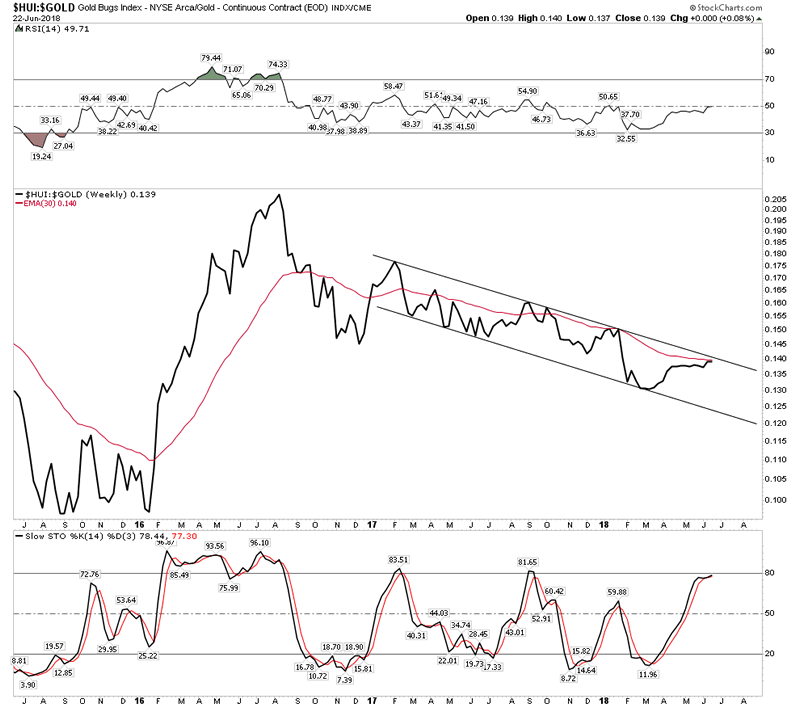
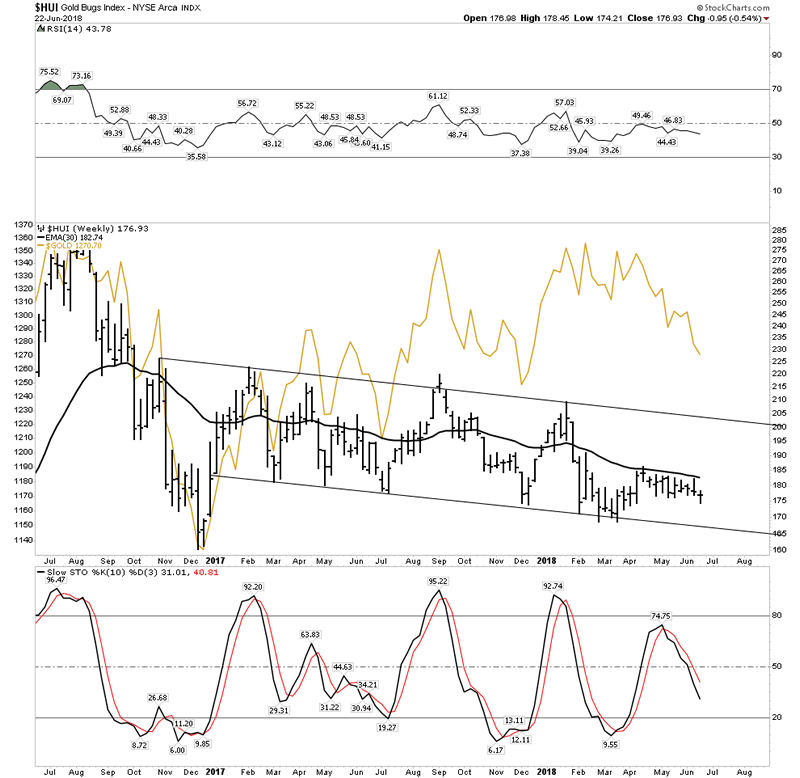
HUI:GOLD:
My prime gold stock indicator the HUI:Gold continues to make progress and is at least primed for a turn upward:
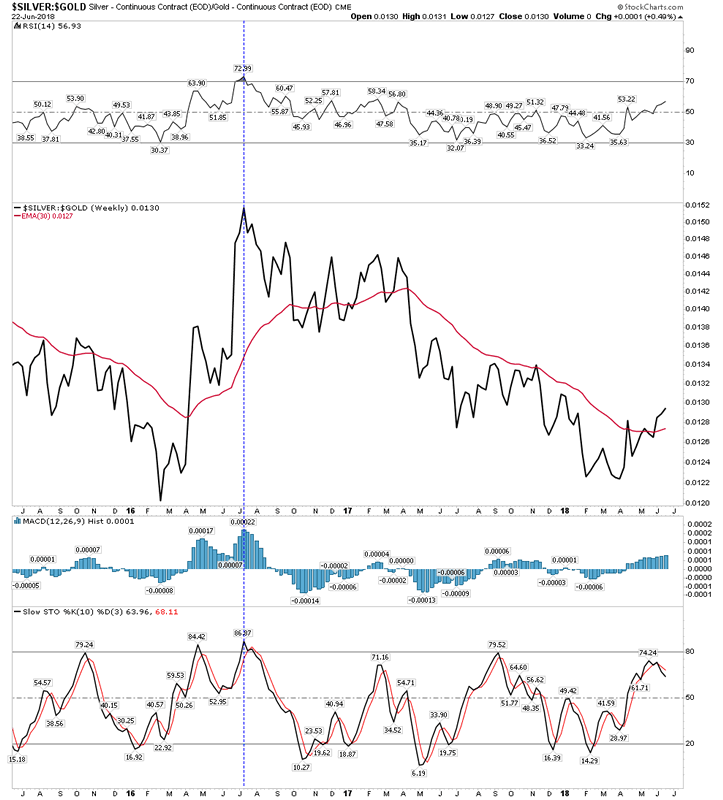
Silver: Gold
Another positive indicator:
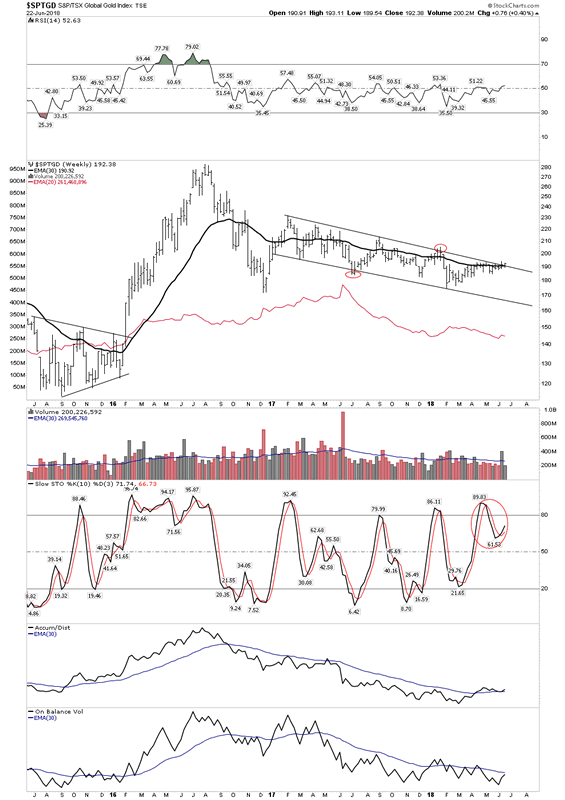
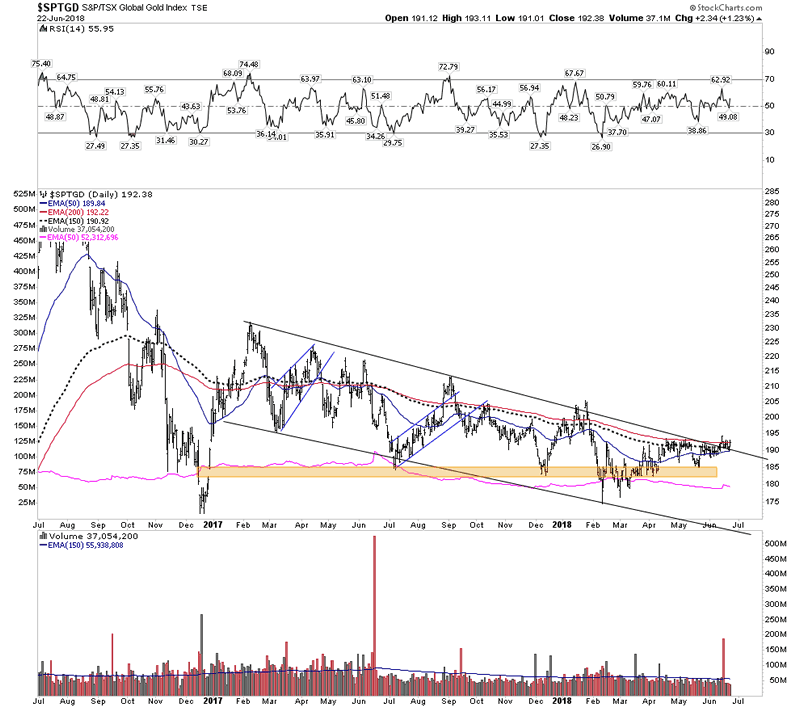
Global Gold Stock Index-
Again things look like they are grinding out a bottom and a turn… the weekly:
Close-Up on the daily:
Gold- Hanging by its fingernails:
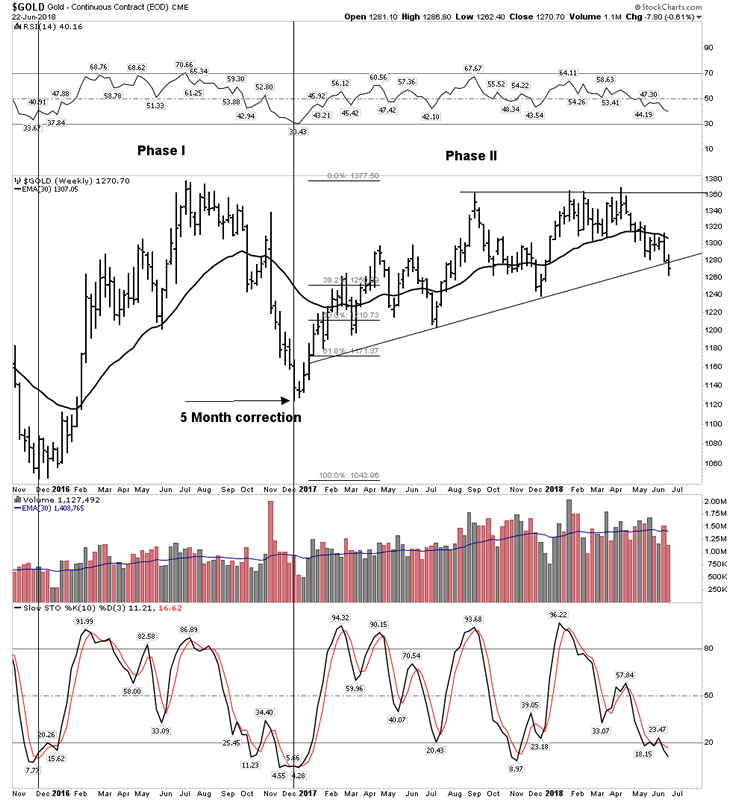
Gold vs HUI
It sure hasn’t felt good, but no reason to panic. Perhaps gold is just resolving its divergence with the stocks, but its still intact.
Bottom Line Gold
If you need to know why gold got splattered over the past 2 weeks I defer to Fred Hickey’s twitter comment:
Now we know why gold dropped $40oz in just a little over a week -the biggest one-week increase in large speculator futures short contracts (from 72.5K to 106.4K up 47%) that I can ever remember. Good news is they’ll have to buy them back as the seasonal strong period gets started
The gold decline was 100%+ due to the shorts – there was actually a (smaller) increase in spec long positions
So I myself am trimming around the edges of my gold stock holdings in case the initial wave down in the PBC takes the gold stocks with it, but I am not selling my core holdings.
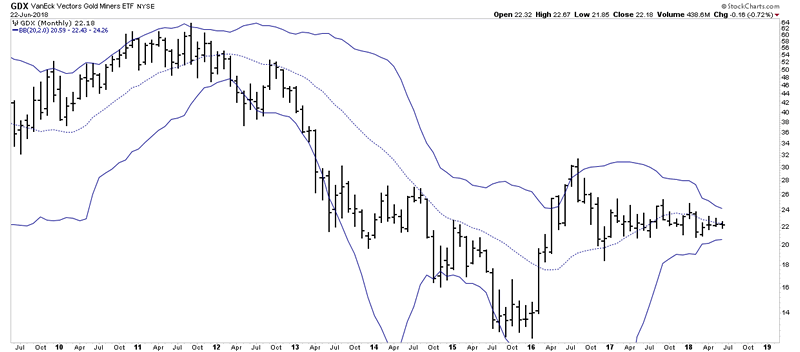
A Big move is Coming
Take a look at the monthly Bollinger Band Pinch. This is telling us a big move is coming. I suggest that since volume is bombed out sellers have already exited so the move is most likely to be to the upside.
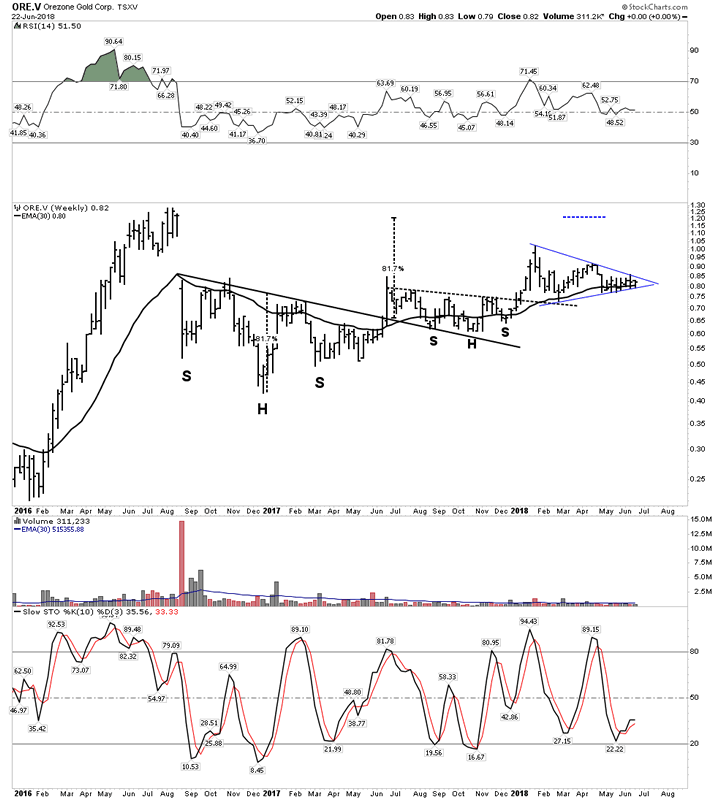
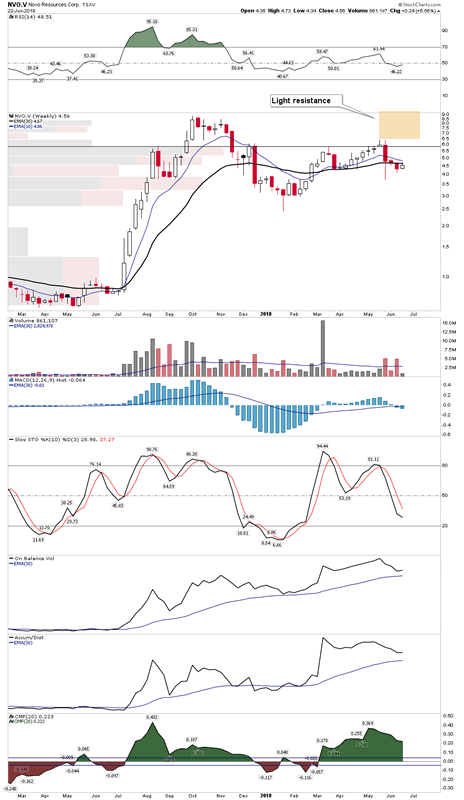
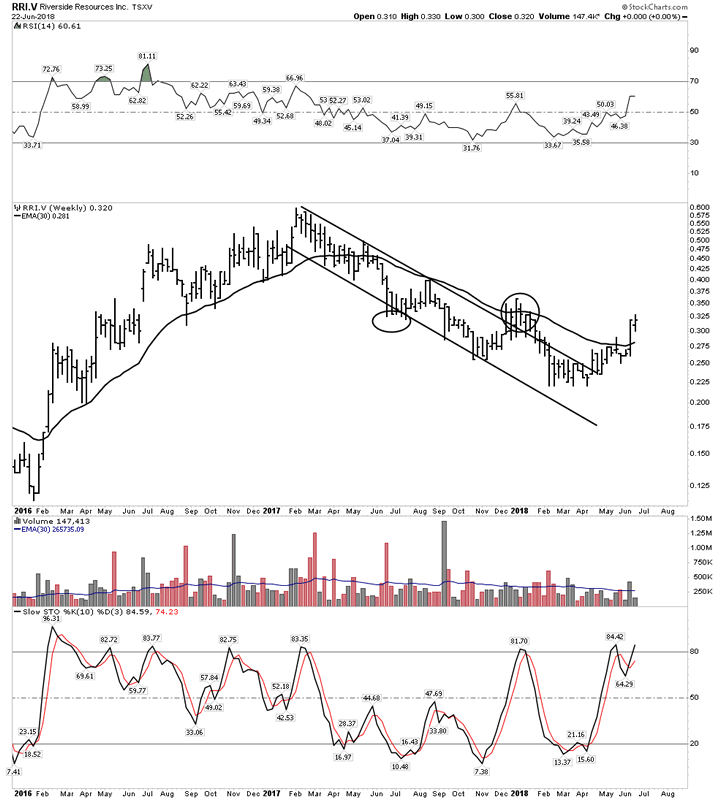
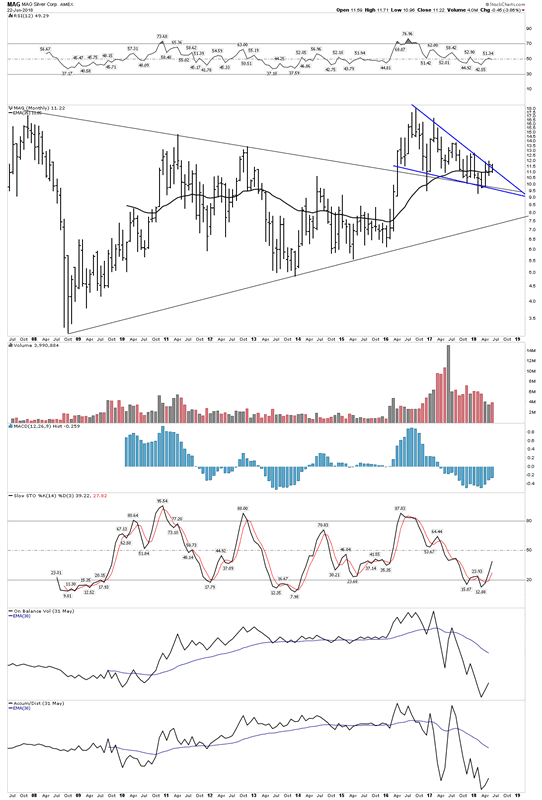
Below are some bullish charts of various metals stocks. It’s why I am not selling:
Orezone: get ready for the takeover:
Novo– I am holding. QH is getting increasingly bullish.
Riverside– Recent trenching results:
MAG- Gathering Steam:
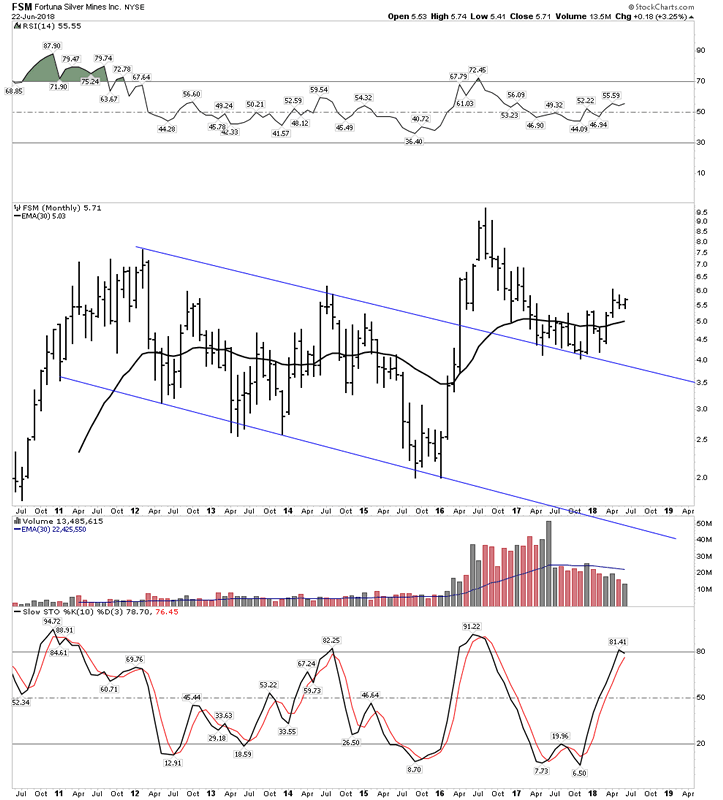
Fortuna- Powerful BT
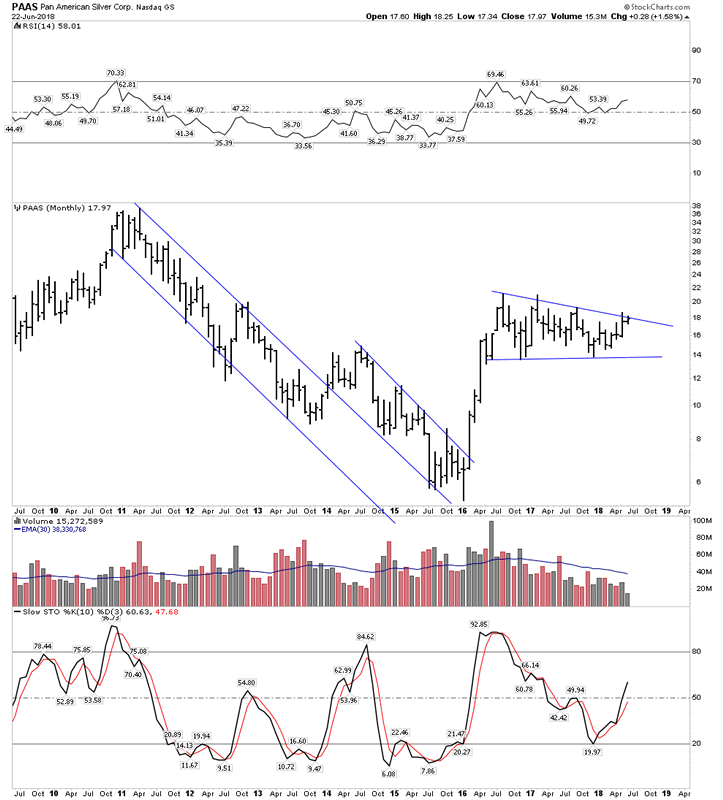
Pan American– Primed
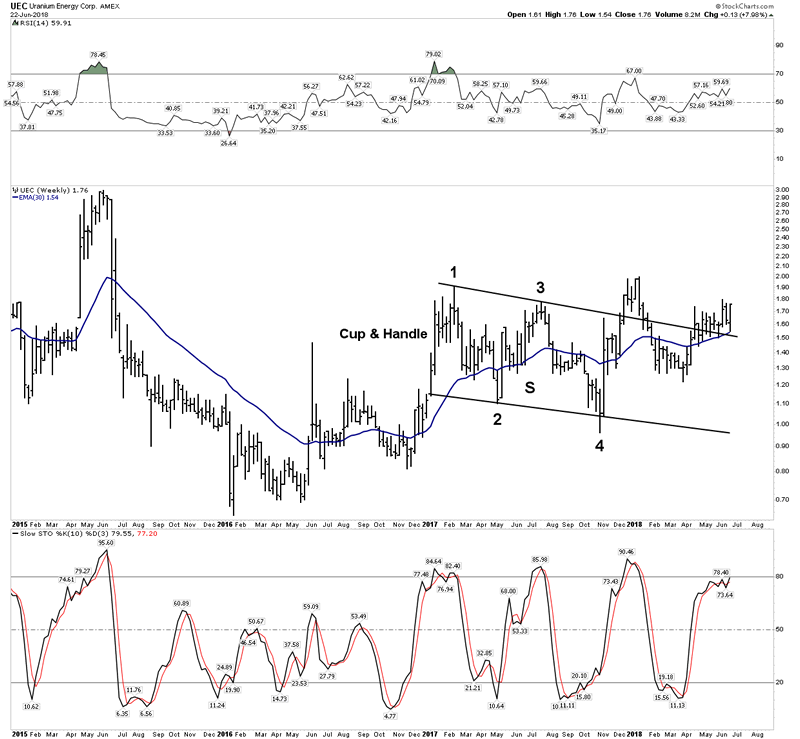
UEC– USA based uranium production
Short Selling
I mentioned the best strategy is to go to the sidelines with the cash you want to hold outside of your core positions. But one should start compiling his short list. You could even start testing the waters to hone your skills, just just don’t get carried away since we don’t know its a bear market yet. Here are some shorts I have taken on.
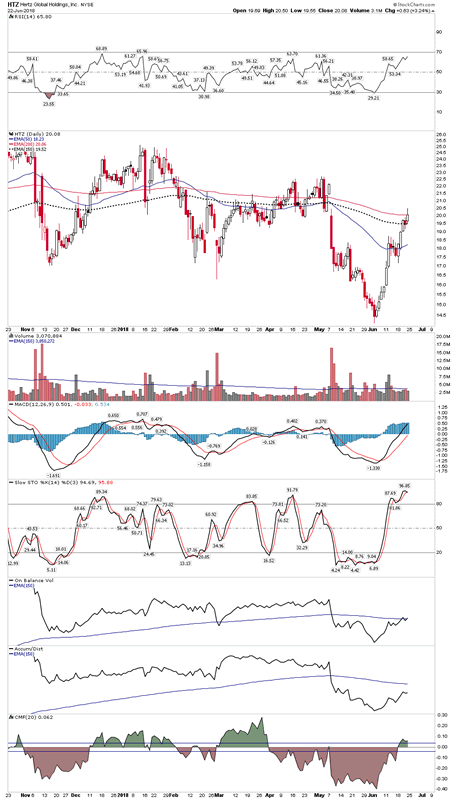
Hertz:
The rental car industry is sick. Their stocks are reflecting this. Hertz has a very large short interest as its no secret they are in trouble. This is likely the reason behind the recent rally in the stock. It’s a short squeeze, but looks like its ending now. Same story with Tesla. The squeeze killed the shorts.
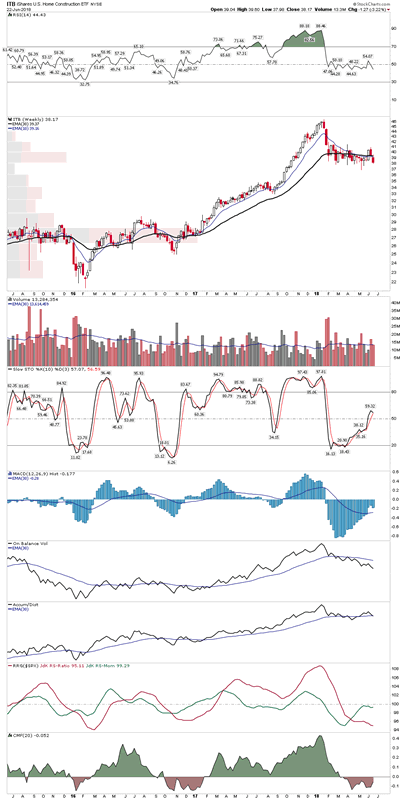
Homebulders
Interest rates, labor and material costs have put the squeeze on homebuilders profitability. Also they have started to write down land purchases. This sector is early stages bear market IMO
ITB Homebuilders Index
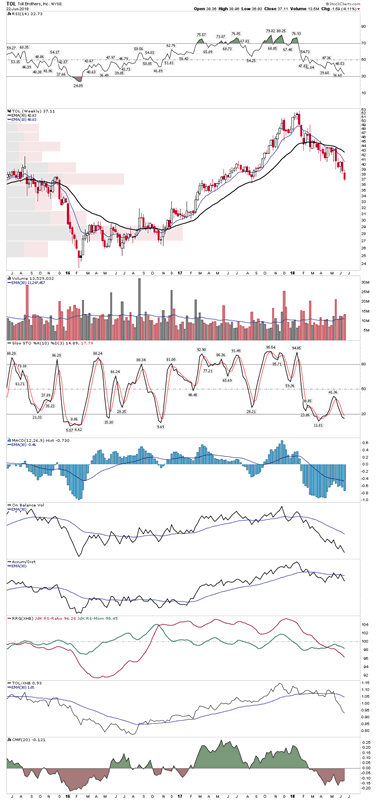
TOL– I mentioned recently this looked like the perfect short tucked up under its 30 EMA. So far so good:
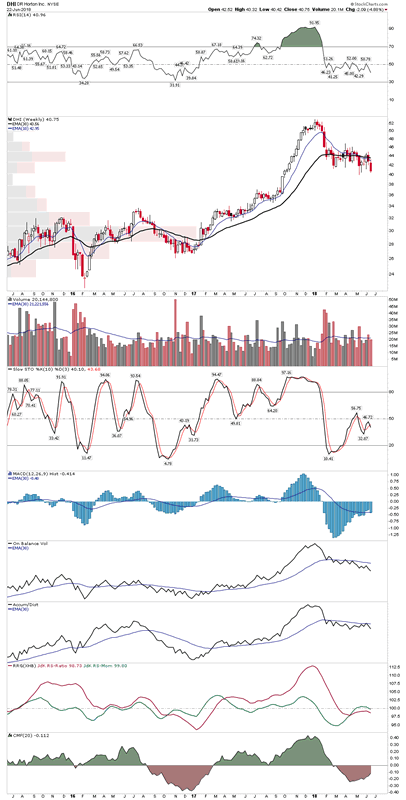
DHI– Nations Largest Homebuilder:
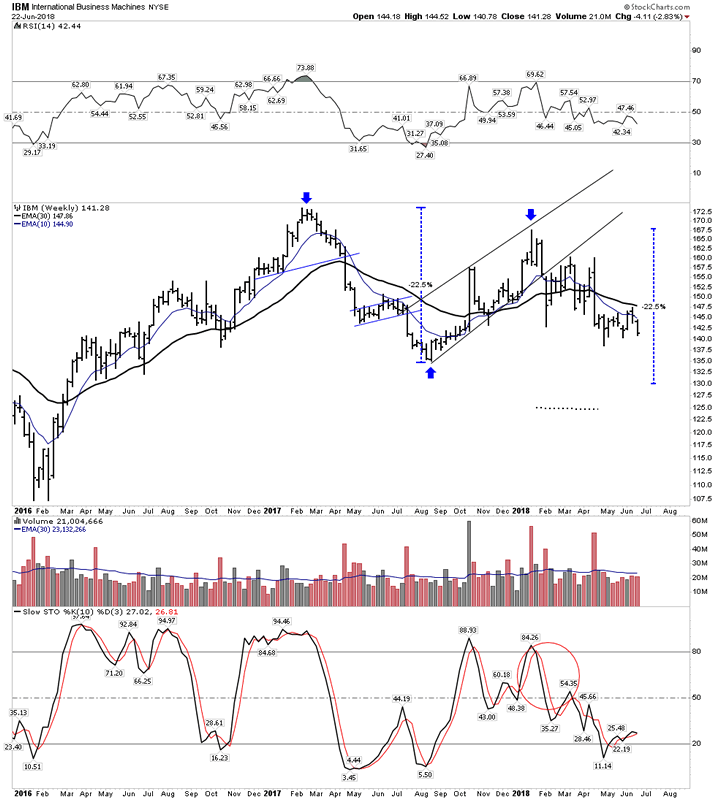
IBM- Industrial Giant
World Wide Look
We don’t have time to take a trip around the world, but let me say this it’s getting ugly out there. Last week I mentioned that the periphery of the world is starting to blow up due to the rising USD, a PBC phenomenon by the way. Let’s look at just a few:
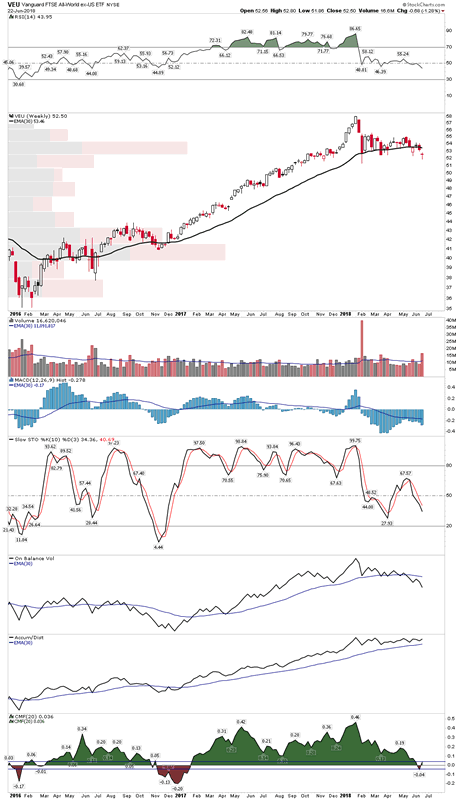
The World… Vanguard All World ex-USA
This has short sale written all over it;
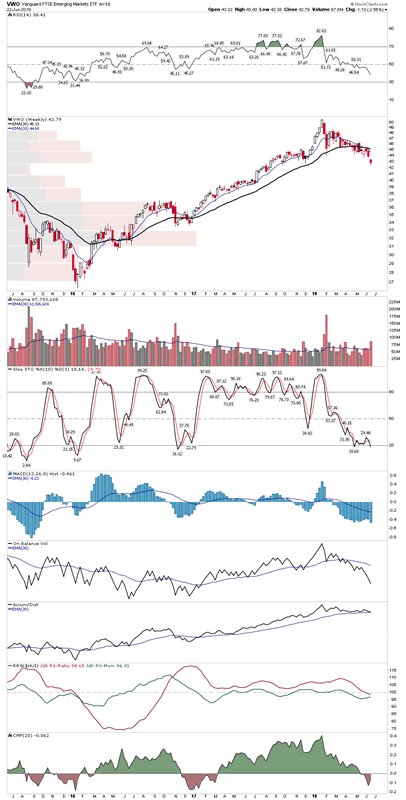
Emerging markets… it get’s worse:
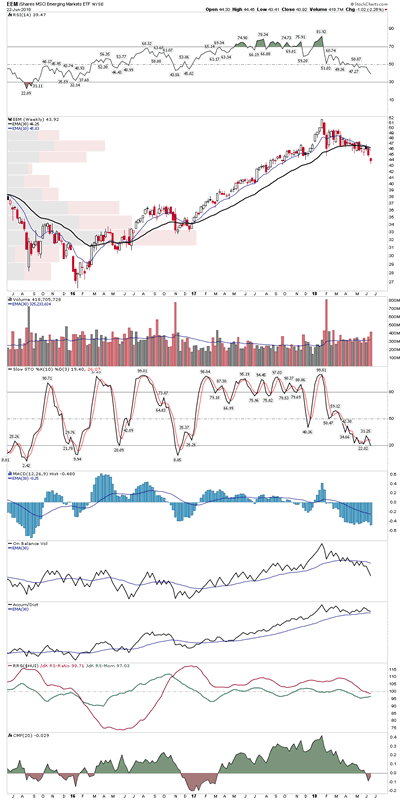
EEM
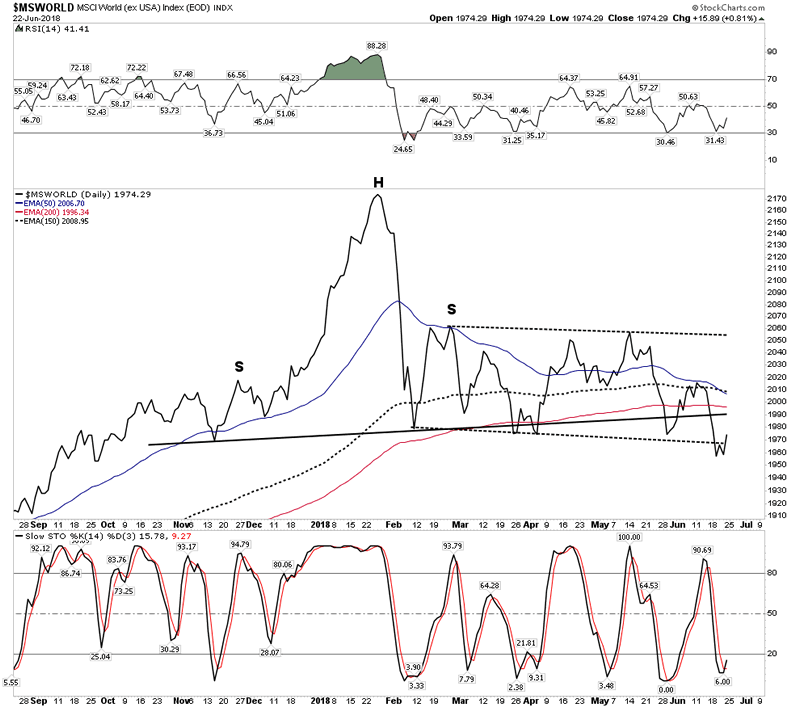
The MS World Ex-USA… Not good:
China-Believe in yourself and the charts
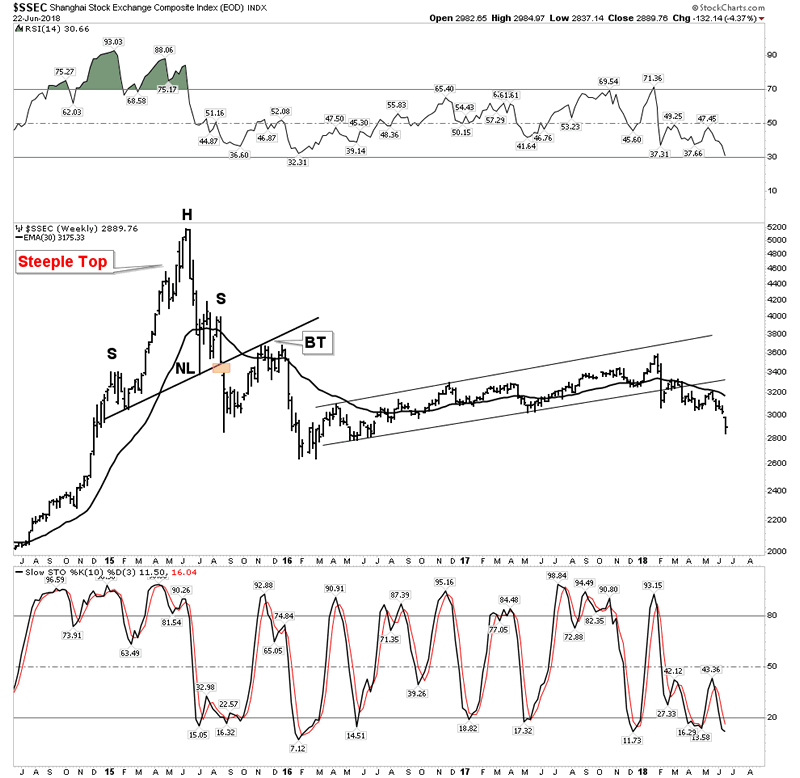
A few months back I posted the below charts on China and mentioned how profoundly bearish they were and they were announcing a deflation. I wasn’t hearing this from other analysts. In fact quite the opposite. Stansberry writer Steve Sjuggerud has been pounding the table all year to buy China and buy in big. Long term no doubt he is right, but this year… I don’t think so. I read his stuff and then look at the chart and I say sorry …no way. One must believe the chart and believe in ones own analysis.
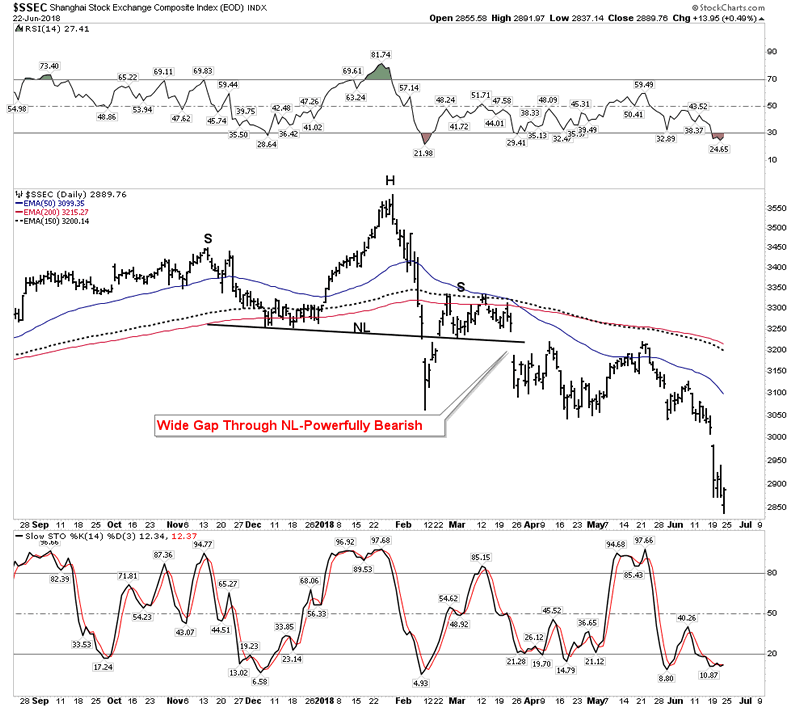
The gap above was the announcement made around the world.. Deflation is coming. I posted this in March… believe the chart!
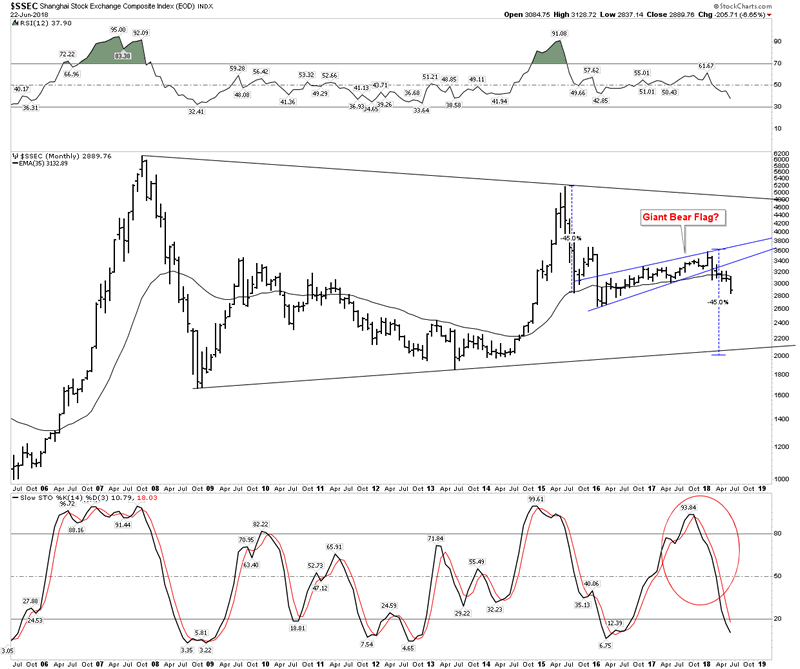
China…OMG
Not the end of the world, but do you think a 40% bear market will do some damage?
Summary
I am working on tons of short sale candidates… they are everywhere. But let’s take our time for now and play defense. If the DOW and Trannies go to a new high together all of this analysis will have been wrong. But what I see here is a process unfolding. You are not going to hear this on CNBC.
Editor’s Note:
Plunger is Rambus Chartology’s Resident Market Historian and an associate writer. For a complete compilation of his work members can check the “Plunger” Tab .
Plunger
Copyright © 2018 Plunger - All Rights Reserved
All ideas, opinions, and/or forecasts, expressed or implied herein, are for informational purposes only and should not be construed as a recommendation to invest, trade, and/or speculate in the markets. Any investments, trades, and/or speculations made in light of the ideas, opinions, and/or forecasts, expressed or implied herein, are committed at your own risk, financial or otherwise. The information on this site has been prepared without regard to any particular investor’s investment objectives, financial situation, and needs. Accordingly, investors should not act on any information on this site without obtaining specific advice from their financial advisor. Past performance is no guarantee of future results
© 2005-2022 http://www.MarketOracle.co.uk - The Market Oracle is a FREE Daily Financial Markets Analysis & Forecasting online publication.