


Stock Market’s Price Action Starting to Turn Bullish
Stock-Markets / Stock Markets 2018 Jun 30, 2018 - 04:00 PM GMTBy: Troy_Bombardia

 As always, the economy’s fundamentals determine the stock market’s medium-long term outlook. Technicals determine the stock market’s short-medium term outlook. Here’s why:
- The stock market’s long term is bullish.
- The stock market’s medium term is bullish.
- The stock market’s short term is turning bullish (with Trump’s trade war as a wild card)
Let’s go from the long term, to the medium term, to the short term.
Long Term
The Medium-Long Term Model is bullish right now. It doesn’t see a bear market or “significant correction” on the horizon. With that being said, here are some medium-long term bullish signs for the stock market from the past week.
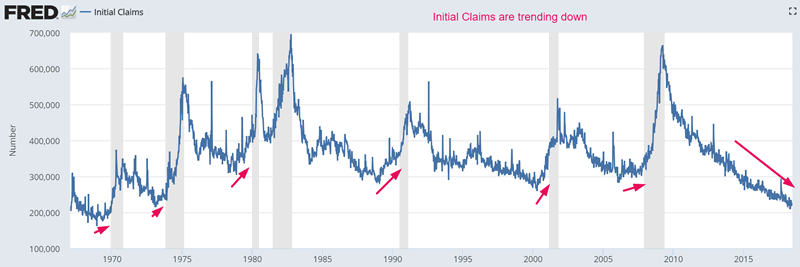
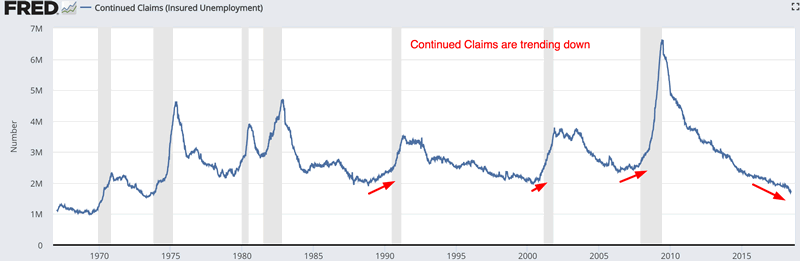
Initial Claims and Continued Claims are still trending lower (improving). These 2 data series move inversely with the stock market. They also lead the stock market.
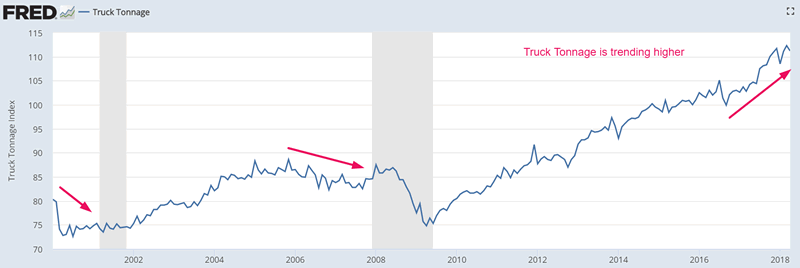
Truck Tonnage continues to trend higher. This is a medium-long term bullish sign for the stock market. Truck Tonnage tends to go down before an equities bear market and economic recession begins.
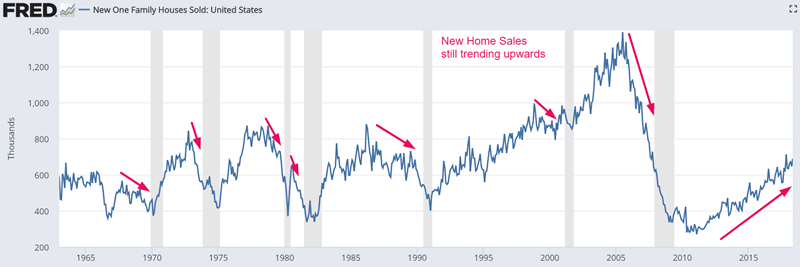
New Home Sales are still trending higher. New Home Sales tend to trend downwards before an economic recession and equities bear market begins.
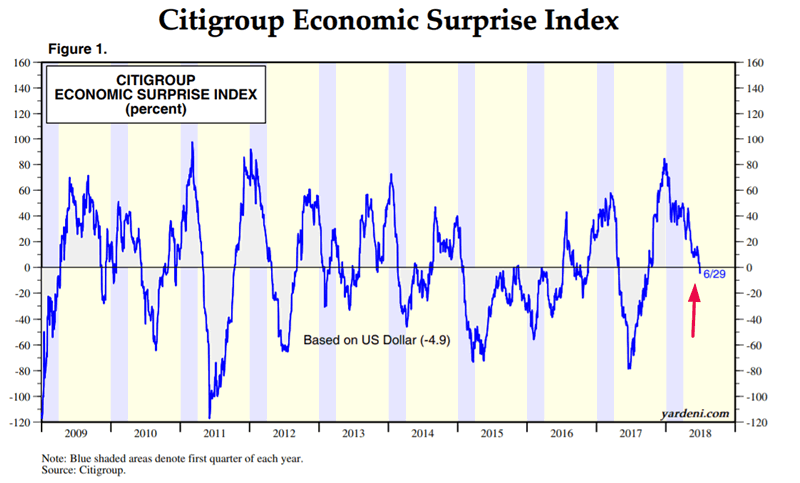
The Citigroup Economic Surprise Index has turned negative. This is pretty much irrelevant for the stock market’s medium-long term. The Economic Surprise Index doesn’t measure whether the economy is improving or deteriorating. It merely measures whether the data is beating or missing analysts’ expectations. The Economic Surprise Index goes negative every half year.
Medium Term
Several studies from the past week continue to suggest that the stock market will trend higher throughout the rest of 2018 (i.e. next 6 months).
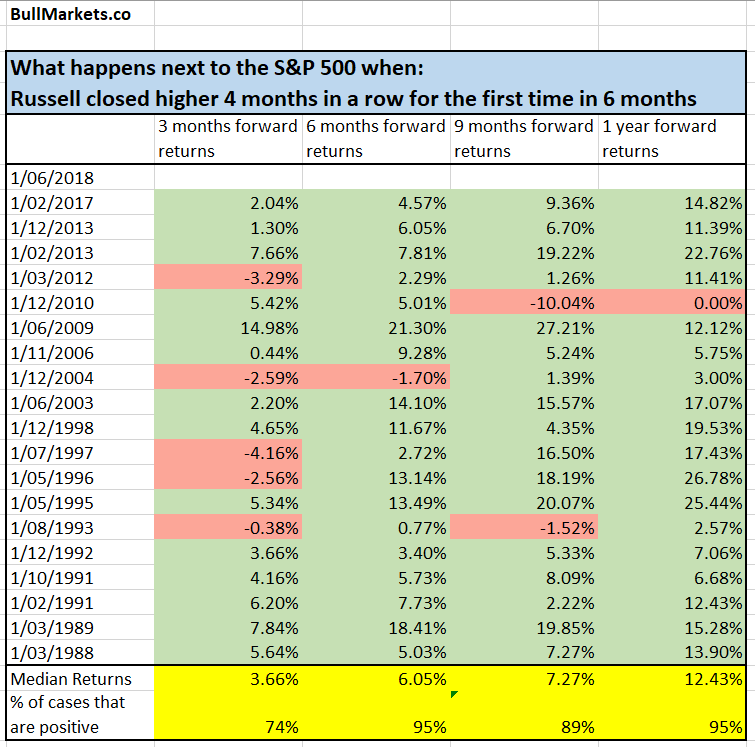
June is over, and the Russell 2000 (small caps index) has gone up 4 consecutive months. When this happens, the S&P 500 has a very strong tendency to go higher in the next 6-12 months.
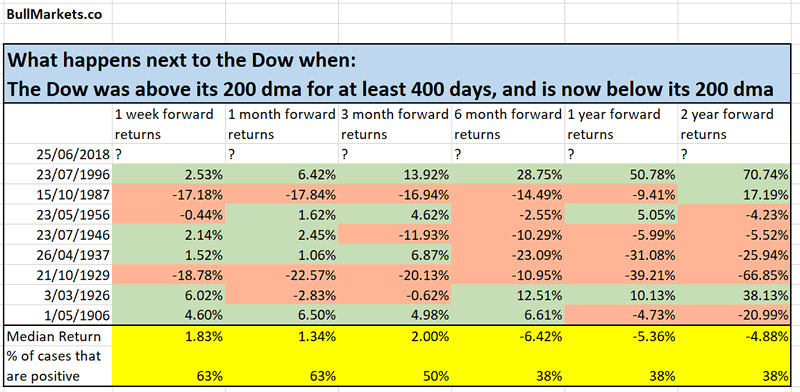
Meanwhile, the Dow broke below its 200 daily moving average, ending a 501 day streak above the moving average. When this happens, the Dow has a tendency to go down in the next 6-12 months.
So which one is it? The above 2 market studies seem to conflict with eachother.
The majority of market studies from last week were very bullish. There are a lot more bullish studies right now than bearish studies. Hence, it is more likely that the stock market will go up in the next 6-12 months.
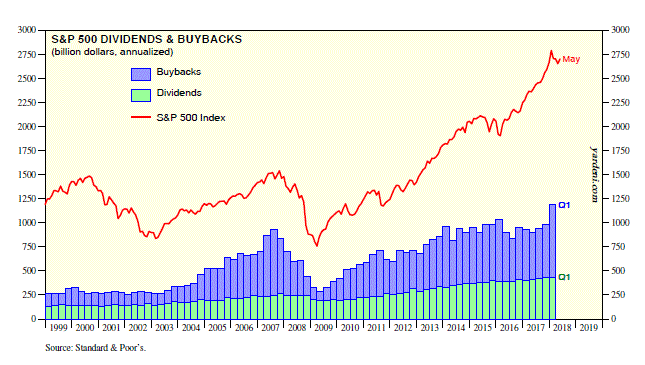
Meanwhile, corporate buybacks continue to put a floor under the stock market. Corporate buybacks are surging whenever the stock market is falling.
Short term
I’d like to focus more on the short term this week. The short term is notoriously hard to predict, which is why I focus on the medium-long term. But there were some interesting developments from the past week.
The stock market is showing some signs of EXTREME fear (which, as contrarians know, is a short term bullish sign). And all the S&P 500 needed to do was fall a mere 3.5%.
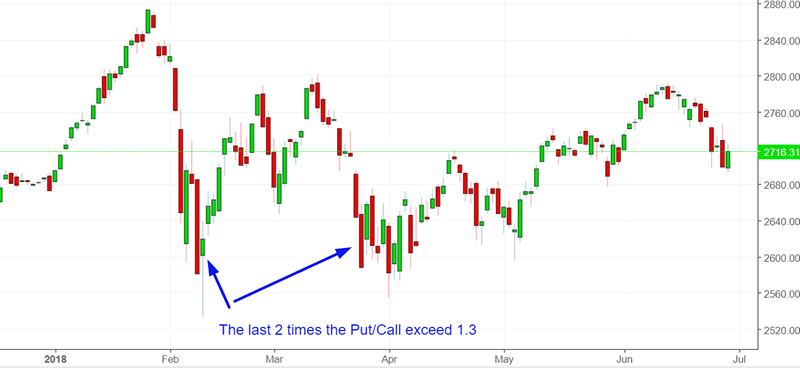
For example, the Put/Call Ratio spiked to 1.32 on Thursday. The last 2 times this happened, the S&P had either already put in a short term bottom or was very close to putting in a short term bottom.
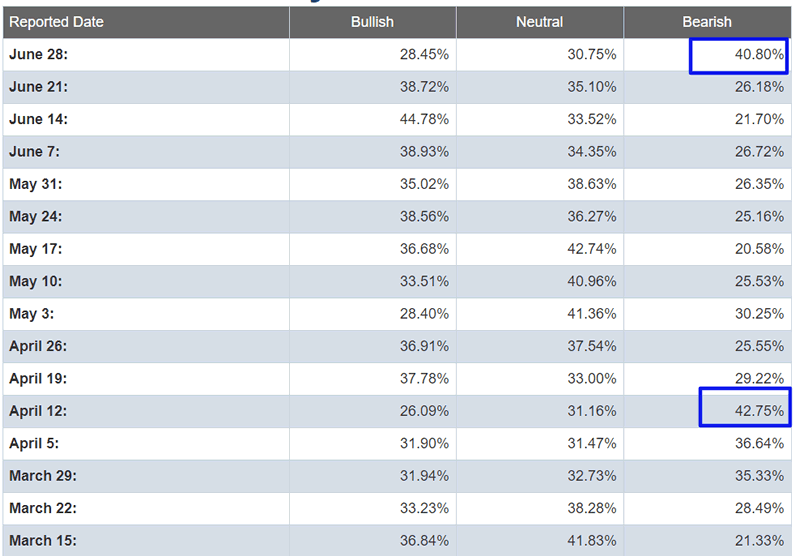
Meanwhile, AAII Bearish Sentiment just hit an extreme of 40.8%.
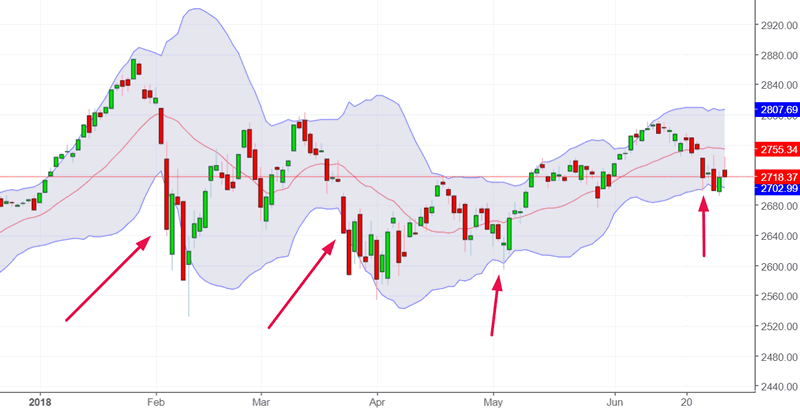
In addition, the S&P has touched its 2 standard deviation lower Bollinger Band (20 dma). The last 3 times this happened, the S&P fell a little more but wasn’t far from making a short term bottom.
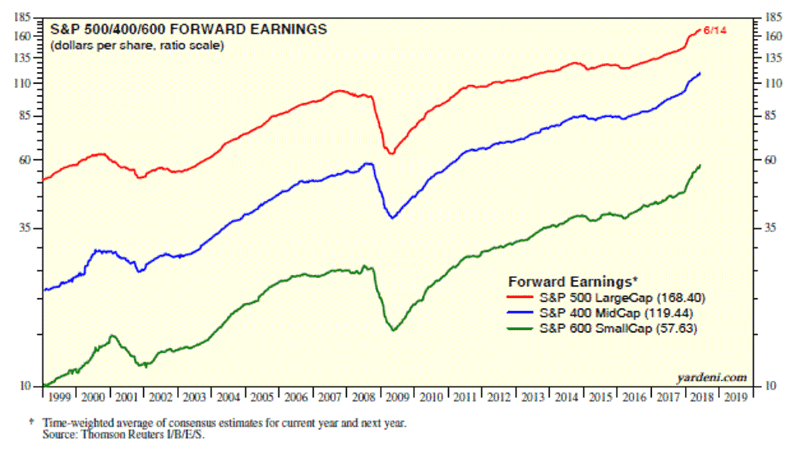
Meanwhile, U.S. corporate earnings estimates continue to trend higher. Q2 2018 earnings season is in the second half of July (2 weeks from now). If the stock market goes down before earnings season, it usually bounces on earnings season.
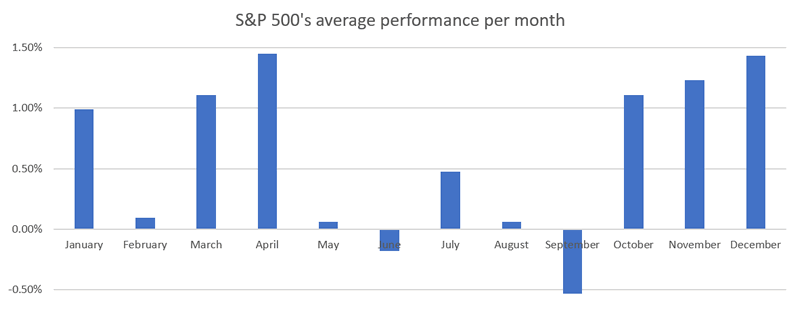
July is also the stock market’s strongest month in the summer. This is mostly due to earnings season. As you can see, the 4 earnings season months (January, April, July, and October) are all bullish months.
Hence, these short term factors paint this picture:
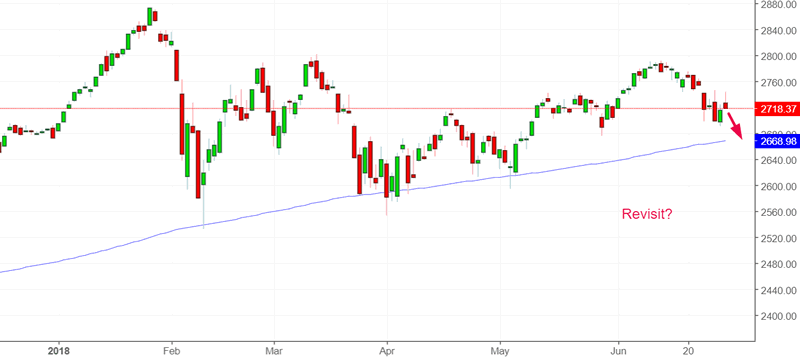
- The stock market might fall a little more in the next 2 weeks. Perhaps the S&P will revisit 2670, which is its 200 daily moving average. HOWEVER,
- This short term weakness is limited in terms of TIME.
- The stock market’s price action (a short term indicator) is starting to turn bullish. It doesn’t need to make a big decline for sentiment to become extremely “fearful”. The stock market has managed extreme fear with a really small decline.
Conclusion
The stock market’s medium term and long term are bullish. Despite all of the stock market’s problems in the first half of 2018, the S&P 500 is still up 1.67%.
This is the stock market’s long term bullish bias at work. Picking tops is much harder than picking bottoms. Selling too early is just as bad as selling too late. If you sell too early, the stock market might still be higher than the price you sold it at after the market falls.
With that being said, we are starting to see signs of bullish price action in the stock market. This is a short term bullish sign. The stock market might fall some more in the next 2 weeks on Trump’s trade war news. But overall, this short term downside is limited by the upcoming Q2 2018 earnings season in the second half of July.
*Focus on the medium term and long term. Focusing too much on the short term is detrimental to your long term trading performance. Professionals focus so much on the short term, which is why the average hedge fund underperforms the S&P 500. Imagine this. In the financial industry, the average PROFESSIONAL underperforms buy and hold. Nonprofessionals can beat the average professional by doing nothing but sitting.
As Warren Buffett said, “the majority of my money has been made by being right and sitting tight“.
By Troy Bombardia
I’m Troy Bombardia, the author behind BullMarkets.co. I used to run a hedge fund, but closed it due to a major health scare. I am now enjoying life and simply investing/trading my own account. I focus on long term performance and ignore short term performance.
Copyright 2018 © Troy Bombardia - All Rights Reserved
Disclaimer: The above is a matter of opinion provided for general information purposes only and is not intended as investment advice. Information and analysis above are derived from sources and utilising methods believed to be reliable, but we cannot accept responsibility for any losses you may incur as a result of this analysis. Individuals should consult with their personal financial advisors.
© 2005-2022 http://www.MarketOracle.co.uk - The Market Oracle is a FREE Daily Financial Markets Analysis & Forecasting online publication.