


Crude Oil Possibly Setting Up For A Big Downside Move
Commodities / Crude Oil Jul 09, 2018 - 05:23 PM GMTBy: Chris_Vermeulen

 Our research team has identified a potential major price rotation setup in Crude Oil that may be one of the biggest opportunities for traders in a long while. Traders need to be aware of this potential move because it could coincide with other news related to foreign markets/economies as well as supply/demand issues throughout the rest of this year.
Demand for Oil is tied to the economic activities throughout much of the globe. When demand for Oil is high, one can perceive the global economy to be performing well and consumer demand for oil-based products rather high. When demand for oil subsidies, it is usually due to economic constraints as a result of slower consumer and industrial demand. The only time demand for oil typically skyrockets are when massive supply disruption takes place or war breaks out.
Current price rotation to the upside has reached and stalled near an upper price channel and coincides with our Tesla Vibrational Theory price arcs. We believe this could be setting up for a big downside price move in the near future. Our interpretation of this setup is that Oil will quickly find pricing pressures near the $74-$75 level and begin to move lower.
Before we continue much further, let’s take a look at some statistical data for the Month of July with Crude Oil.
Over 36 total months of scanned data (data going all the way back to 1983) we can determine the following :
** All data related only to the month of July **
Total price activity over those 36 total months:-$5.28
Total Monthly Positive Results = $49.78 spanning 24 total months – Averaging $2.07
Total Monthly Negative Results = -$55.06 spanning 12 total months – Averaging -$4.59
Largest Positive Month = +$8.47
Largest Negative Month = -$15.92
This data tells us that July is more often resulting in a positive price move (by a 2:1 ratio), yet the upside totals do not out perform the downside moves. The downside price moves for July total nearly 10% more than the total upside price moves and equates to exactly half the number of instances (12 vs. 24).
This data suggests to us that any potential downside move in Crude could be well in excess of -$4.00 and could be as large as -$10.00 or more. If our analysis is correct that Crude could rotate much lower based on our price channels and Tesla theory setup, we could be in for a move to below $64.00 ppb here soon if price confirms a breakdown on a close below $72.
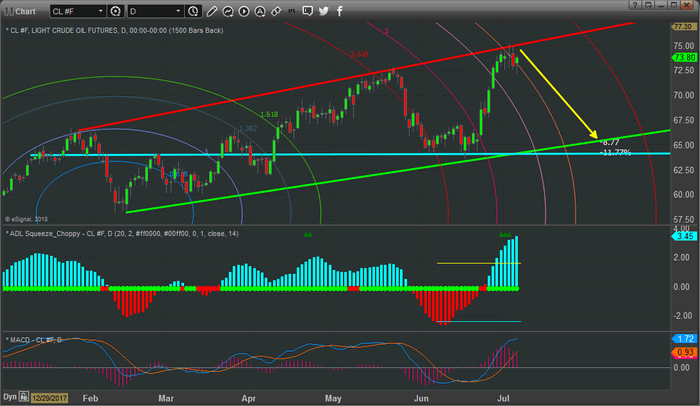
This Daily Crude Oil chart shows the wedge formation and our Tesla price vibrational arcs that we believe are set up for a potential downside price rotation move. Obviously, we can see that Oil has rotated within this channel at least twice before – which is why we believe this current downside rotation could have a high probability of happening. Additionally, our predictive modeling system is suggesting price weakness this week in Crude Oil.
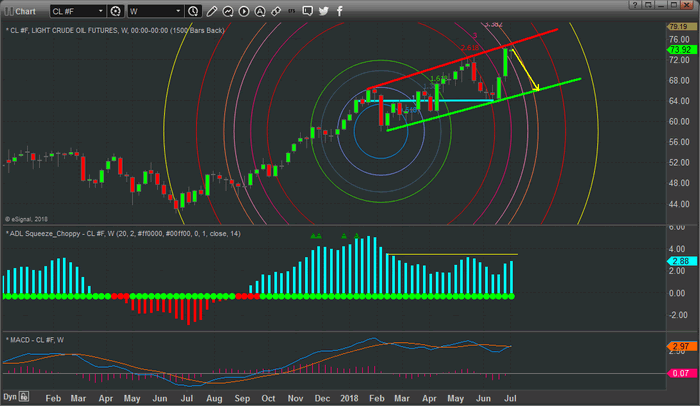
This Weekly Crude Oil Chart below shows the same pattern over a longer span of time. Our belief that the $64.00 support level (shown as a horizontal CYAN support line) will be retested over the next 2~5+ weeks if this projected price rotation plays out could mean that if the $64.00 level is breached, we could see Oil fall to well below $60.00 ppb headed into the end of this year.
Consider this fact of data for a minute as we consider this possible price rotation. Since 1983, using quarterly price data, the Q4 historical data show us the following:
Total Q4 Price Move: -$80.71 over 36 Q4 data points
Total Positive Q4 Data: +$85.87 over 14 data points – Averaging +$6.13
Total Negative Q4 Data: -$116.58 over 21 data points – Averaging -$7.93
Largest Q4 upside move: +$19.63
Largest Q4 downside move: -$56.04
Downside price action in Crude Oil is nearly 33% more predictable than upside price action in Q4 with the largest price changes reflecting almost +300% greater chance of downside price collapse than upside price rally.
We may be a bit early with our prediction near this upper price channel, but we believe this could be a super trade going into the end of this year. We just have to wait for the move to accelerate and begin to rotate lower.
Have you been following our analysis recently? Did you catch the upside price move in the US equities markets like we have been predicting for the past few months? How about the moves in the metals markets – did you catch those too? Want to learn how a small and very dedicated team of researchers and traders can assist you in developing greater success for your trading and help you stay ahead of these market moves?
Then visit www.TheTechnicalTraders.com to learn how we can help. Our members receive proprietary research, daily video content, detailed trading signals and much more to assist them in finding great trading opportunities and staying ahead of these crazy market moves. Join the Wealth Building Trading Newsletter today to learn how we can help you become more successful.
Chris Vermeulen
www.TheTechnicalTraders.com
Chris Vermeulen has been involved in the markets since 1997 and is the founder of Technical Traders Ltd. He is an internationally recognized technical analyst, trader, and is the author of the book: 7 Steps to Win With Logic
Through years of research, trading and helping individual traders around the world. He learned that many traders have great trading ideas, but they lack one thing, they struggle to execute trades in a systematic way for consistent results. Chris helps educate traders with a three-hour video course that can change your trading results for the better.
His mission is to help his clients boost their trading performance while reducing market exposure and portfolio volatility.
He is a regular speaker on HoweStreet.com, and the FinancialSurvivorNetwork radio shows. Chris was also featured on the cover of AmalgaTrader Magazine, and contributes articles to several leading financial hubs like MarketOracle.co.uk
Disclaimer: Nothing in this report should be construed as a solicitation to buy or sell any securities mentioned. Technical Traders Ltd., its owners and the author of this report are not registered broker-dealers or financial advisors. Before investing in any securities, you should consult with your financial advisor and a registered broker-dealer. Never make an investment based solely on what you read in an online or printed report, including this report, especially if the investment involves a small, thinly-traded company that isn’t well known. Technical Traders Ltd. and the author of this report has been paid by Cardiff Energy Corp. In addition, the author owns shares of Cardiff Energy Corp. and would also benefit from volume and price appreciation of its stock. The information provided here within should not be construed as a financial analysis but rather as an advertisement. The author’s views and opinions regarding the companies featured in reports are his own views and are based on information that he has researched independently and has received, which the author assumes to be reliable. Technical Traders Ltd. and the author of this report do not guarantee the accuracy, completeness, or usefulness of any content of this report, nor its fitness for any particular purpose. Lastly, the author does not guarantee that any of the companies mentioned in the reports will perform as expected, and any comparisons made to other companies may not be valid or come into effect.
Chris Vermeulen Archive |
© 2005-2022 http://www.MarketOracle.co.uk - The Market Oracle is a FREE Daily Financial Markets Analysis & Forecasting online publication.