


Yield Curve Inversion a Remarkably Accurate Warning Indicator For Economic & Market Peril
Economics / Economic Theory Jul 11, 2018 - 11:14 AM GMTBy: Dan_Amerman

Would you have appreciated a single number that could have given you a clear and unmistakable warning before the tech stock bubble collapsed? How about an unequivocal mathematical warning in 2006 that major financial trouble was on the way, well before the problems of 2007 and 2008?
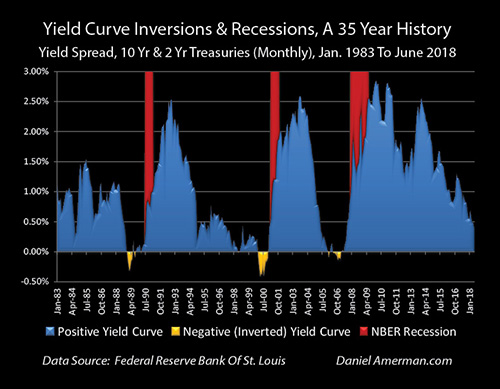
These warnings did exist and they can be seen in the gold areas of the graph above. They are called "yield curve inversions", and are quite uncommon, having occurred only three times in the last 35 years. The red areas show the three recessions of the last 35 years - and as can be readily seen, each yield curve inversion has been relatively quickly followed by a recession.
After languishing in obscurity for many years, "yield curve inversions" are back in the news again, because we just may be nearing another inversion.
In this nine step analysis, we will review what yield curve inversions are, consider the potential for Fed rate increases leading to another inversion, explore the fundamentals of why inversions can be such an accurate early indicator of coming recessions, and look at the powerful information value for investors and investments.
This analysis is part of a series of related analyses, an overview of the rest of the series is linked here.
1. Definition
A yield curve is the relationship between interest rates and maturity at any point in time. The graph below shows the fairly normal yield curve just before the Federal Reserve began its cycle of increasing interest rates.
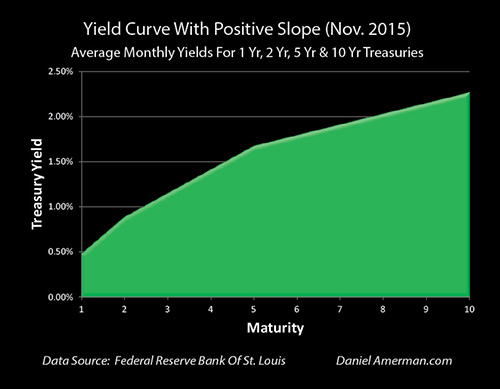
Interest rate yields are the vertical axis, the maturity of the bond or other fixed income asset is the horizontal axis, and the overwhelming majority of the time, long term interest rates are higher than short term interest rates. This means that the slope of the line is positive, rising as we go from left to right (only the 1, 2, 5 and 10 year yields are actual market yields, the rest are interpolated between them).
Investors take greater price and inflation risk with long term bonds than short term investments, and they almost always demand extra yield in compensation for the extra risk.
The graph below shows something far less common, which is an inverted yield curve. In this case it is from November of 2006, just over a year before the start of the Great Recession and the Financial Crisis of 2008.
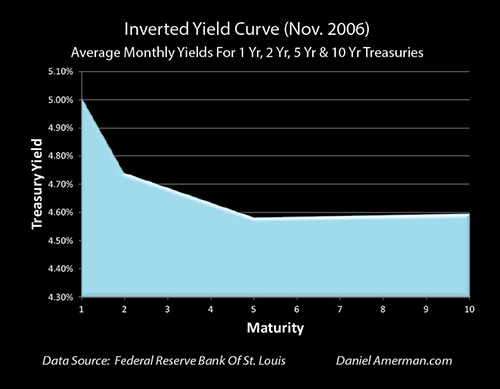
Short term rates are higher than long term rates. The slope is now falling as we go from left to right, and this negative slope is referred to as an "inversion" in the yield curve.
Of course, there are an almost infinite number of possible shapes for yield curves and inverted yield curves. As a simplification measure, one commonly used market definition is to say that there is an inverted yield curve when the yield on 2 year U.S. Treasury notes exceeds the yield on 10 year U.S. Treasury bonds. Another commonly used measure is to compare the 3 month and 10 year yields, while others compare Fed Fund rates and 10 year yields.
2. History & Current Status
Every recession since 1975 - including the Financial Crisis of 2008 - has been preceded by an inverted yield curve (as defined by the 2 year Treasury having a higher yield than the 10 year Treasury).
The difference between the 2 year and 10 year Treasuries as of July 5, 2018 was 0.28%, which is the narrowest gap since August of 2007, shortly before the Financial Crisis.
In July of 2017 the average gap was 0.95%, which means the gap has narrowed by 0.67% in the last year. Should the relationship change by another 0.29%, we will have an "official" yield curve inversion. This could result from short term yields rising faster than long term yields, or long term yields falling faster than short term yields, or various combinations thereof.
3. Federal Reserve Interest Rate Increases
The Federal Reserve is currently in an increasing interest rate cycle as can be seen below, having raised interest rates by 1.75%% since 2015.
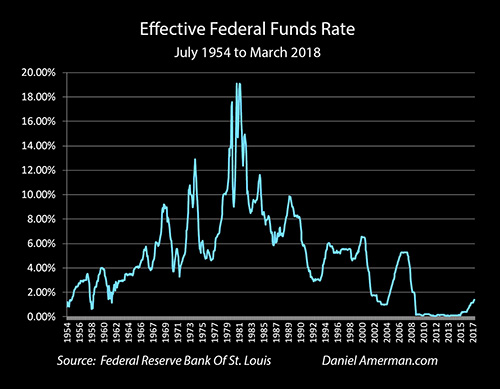
There is not a precise relationship between the Fed Funds rate, and 2 and 10 year Treasury yields. That said, the Federal Reserve's actions typically have a much more direct impact on short term rates than long term rates.
The Fed is expected to increase rates two more time in 2018, with each of those increases expected to be by 0.25%. If that happens, and if the relationship continues where the 2 year yield is more influenced than the 10 year yield, then the next Federal Reserve rate increase (the third of 2018) could narrow the yield curve gap to 0.04%. A fourth interest rate increase could invert the yield curve by 0.21%.
So all it potentially takes is the Fed following its publicly stated game plan of increasing rates by another 0.50% before the end of 2018, with that continuing to have a larger impact on short term than long term rates, and that could be enough to produce an inverted yield curve by the end of 2018.
4. Fundamentals & Causation
Perfect historical correlations (at least in modern times) are nice, but the existence of fundamental reasons for the correlation are even more convincing. And there indeed, fundamentals based reasons for why inverted yield curves should precede recession.
As a starting point, yield curve inversions generally occur when the Federal Reserve has been boosting interest rates. Because the interest rates that the Federal Reserve raises are short term, this tends to push the short term up relative to the long term, which is exactly what has been happening.
The reason the Fed is increasing rates is to slow down the economy. Now, If high economic growth is expected into the indefinite future, then the main danger for bond investors is inflation, and long term bond yields should be rising relative to short term yields.
However, if lower economic growth is expected, then less of a premium is required to compensate for inflationary expectations, and long term yields should be falling relative to short term yields.
So, the net effect of the Fed's increasing interest rates to slow down economic growth is to simultaneously increase short term rates while reducing long term yields relative to short term yields. This first produces flattening, and then sometimes - but not always - there is an eventual inverted yield curve.
This exact pattern was part of the last three inversions and recessions - and it is well under way right now.
Another key factor is the role that profit-seeking institutional investors play in changing the yield curve when their expectations for future economic growth change. If a slowdown in economic growth or a recession is expected, then professional investors know this will almost certainly be accompanied by the Federal Reserve decreasing interest rates.
Because bond prices move the opposite direction from bond yields, this will increase bond prices, and of particular importance is that this will then disproportionately increase long term bond prices relative to short term government obligation prices. It now becomes rational to demand higher yields for short term notes than long term bonds, as a reward for missing out on the expected capital gains in long term bonds.
It should be also be noted that a flattening and potentially inverting yield curve is an entirely rational investor response to fears of a trade war creating widespread economic damage. This is not separate from the Fed interest rate cycle, but can merge together and even become multiplicative.
5. When Conditions Aren't Normal
The inversion of yield curves prior to a recession was a normal part of the business cycle in the 20th century, and could be safely ignored by most retirement and other long term individual investors. Bond yields would get weird for a bit, there would be a recession, and then there would be a recovery with a return to economic growth that would produce more wealth than ever.
So the recommended strategy was to just buy and hold and don't worry about it, the passage of enough time and the corresponding economic growth would take care of the normal interim bumps in the road.
However, as explored in the analysis linked here, we have not been in the normal business cycle for going on twenty years. Instead, we have seen two asset bubbles (tech stocks and real estate) create particularly severe market losses when they popped, which were followed by ever more extraordinary Federal Reserve interventions.
There has been an A-B-C-D cycle where:
A) the Fed lowers interest rates in response to recession;
B) which does boost economic growth and even create asset bubbles;
C) which leads to a cycle of the Fed increasing interest rates (such as we are in right now); and
D) that then leads to the popping the asset bubbles with major investor damage and an even more severe recession.
As was reviewed in the linked analysis, the question was that given A, B and C had already happened or were currently occurring, would D be following again, with major market and economic damage?
It is also worth noting that the last interest rate inversion followed the Fed's last increasing interest rate cycle of 2004 to 2006, with those being followed by the Financial Crisis and the largest recession of modern times. The dates and sequence from the last time around are worthy of careful review:
1) The Federal Reserve rapidly increased interest rates between May of 2004 and July of 2006.
2) The yield curve first inverted in February of 2006, and was predominately inverted until May of 2007.
3) Concerned about a potential looming recession, the Fed went the other direction and began rapidly decreasing interest rates in August of 2007.
4) The "Great Recession" officially arrived in December of 2007.
6. Potential Yield Curve Inversion Reinforces The Likelihood Of The Cycle Recurring
A flattening yield curve which inverts (if that happens) does not guarantee a future recession and possible new financial crisis - but it greatly reinforces the chances that such an outcome will occur.
Yield curve inversions are not random, and they are not frequent. On the quite infrequent occasions when they do occur, they have historically had a very high predictive value when it comes to near term recession.
Accepting lower yields for longer term assets is not rational behavior for investors - unless they are convinced that a recession or slowdown in economic growth will lead to decreased interest rates. It is the market using its money to vote - and history shows that market has been very accurate when it comes to this particular kind of vote.
Again, the inversion has not yet occurred and there is no guarantee of outcome. But as a potential inversion nears, it is an independent but quite powerful reinforcement of the likelihood of the A-B-C-D cycle occurring again.
7. A Potential Deeper Crisis
Unfortunately, there are multiple reasons to believe that another recession could contribute to particularly severe market losses.
Among them is that the higher the height - the potentially greater the fall. As explored in the analysis linked here, historically low interest rates have contributed to historically high valuations in stocks, bonds and real estate. In the event of recession contributing to a market plunge or even new financial crisis, there could particularly devastating losses on a percentage basis in multiple asset categories.
There are also issues with the average age of the populations, as well as the far larger size of the national debt compared to 2008. Add in the rapidly escalating costs of paying for Social Security and Medicare promises, and the financial situation could be far worse than it was in 2009 or 2010.
8. The Containment Of Crisis Cycle
If there is another crisis, however, that does not mean that the world stops there. The key to previous A-B-C-D cycles has been that A has followed D each time. I find the graphic below to be useful for visualizing and exploring the relationships and possibilities.
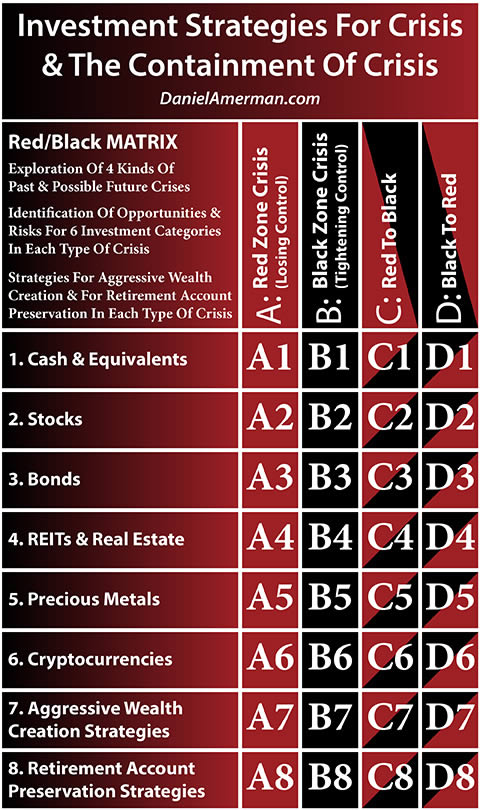
(Red/Black matrix pdf link here.)
A pure "Red Zone" crisis could certainly be the path ahead, creating the red A column with likely dramatic results for each asset category.
But history also shows that if such a crisis occurs, the government and Federal Reserve will do everything they can to contain the crisis. The actions they take are likely to also change investment results and asset prices in each of the asset categories, creating the black B column in the matrix.
It is important to keep in mind that investment results over most of the last twenty or so years have not been based on the fairly brief Red Zone crises, but the far longer term Black Zone containment of crisis. And among the investment results have been some of the highest asset prices we have ever seen, in multiple asset categories.
That said, there is something unprecedented about this potential inversion, and it is among the reasons that a new Black Zone containment of crisis is likely to have a different impact than the previous ones.
We've never seen a yield curve inversion occur in the modern era with interest rates this low. So the principles are the same, but the specifics are different, and by itself, this divergence may be sufficient to lower the confidence level a bit.
The bigger issue is that the Fed has less room to lower rates than it has had each of the previous times. So its main tool is likely to be at the lowest level of effectiveness that it has been, coming into what could the biggest challenge in terms of market losses and recession.
One way of interpreting this situation is that the chances of the Fed failing to contain the crisis are higher than they have previously been, and that the odds of an out of control financial crisis are greater.
Another possibility is that the government and the Federal Reserve will have to put a record amount of effort (and potential rule changes) into the containment of crisis - which could lead to record movements in asset prices in some categories.
9. Inversions Are A Signal That A Change In The Cycle Is Coming
The best way to use a potential inversion in the yield curve is not as an infallible sign that a financial doomsday is nigh, but rather, as a fundamentally based indicator that an actionable change in the cycle will be upon us soon.
The basis for the yield curve inverting is the combination of cyclical Federal Reserve actions, and the institutional investors (who dominate the bond markets) voting with their money that they believe that a change in the cycle will indeed be occurring in the near future. In the endless cycle of recessions and expansions, they are changing how they value short versus long term interest rates, because of what they believe to be the oncoming cyclical change.
Every time we have seen an actual change in the cycle since 1975, every time that a recession has occurred - it has been preceded by the Fed acting as it right now, as well as this quite uncommon "vote".
Looking back over the last 35 years specifically, the gold "vote" was only taken three times (in three clusters), and the only three changes in the business cycle to recession happened relatively shortly thereafter. In the latter two cases, just following the single number of a negative yield spread would have indeed provided clear warning of a cycle change in what would become the two biggest market debacles of recent decades.
So if a yield curve inversion does occur in the coming months or years - it should be taken as a signal that there is a very good chance that a change in the cycle is not far away. Which means that at least one set of major asset price changes across all the investment categories is likely. And if that Red Zone is followed by a new Black Zone containment of crisis - there is likely to be another and quite different cycle of major price changes across the asset categories.
To have an early and highly reliable indicator of coming changes in the cycles of the markets and the economy would obviously be of immense value, and this is particularly so in this time of elevated asset prices even as tens of millions of Boomer investors near and enter retirement. The future is never certain and whether a 4th recession would follow a 4th inversion can't be know in advance. That said, the historical track record and fundamental theory behind this warning indicator are remarkable, and I hope that you have found this analysis to be helpful in better understanding yield curve inversions.
Daniel R. Amerman, CFA
Website: http://danielamerman.com/
E-mail: mail@the-great-retirement-experiment.com
Daniel R. Amerman, Chartered Financial Analyst with MBA and BSBA degrees in finance, is a former investment banker who developed sophisticated new financial products for institutional investors (in the 1980s), and was the author of McGraw-Hill's lead reference book on mortgage derivatives in the mid-1990s. An outspoken critic of the conventional wisdom about long-term investing and retirement planning, Mr. Amerman has spent more than a decade creating a radically different set of individual investor solutions designed to prosper in an environment of economic turmoil, broken government promises, repressive government taxation and collapsing conventional retirement portfolios
© 2018 Copyright Dan Amerman - All Rights Reserved
Disclaimer: This article contains the ideas and opinions of the author. It is a conceptual exploration of financial and general economic principles. As with any financial discussion of the future, there cannot be any absolute certainty. What this article does not contain is specific investment, legal, tax or any other form of professional advice. If specific advice is needed, it should be sought from an appropriate professional. Any liability, responsibility or warranty for the results of the application of principles contained in the article, website, readings, videos, DVDs, books and related materials, either directly or indirectly, are expressly disclaimed by the author.
© 2005-2022 http://www.MarketOracle.co.uk - The Market Oracle is a FREE Daily Financial Markets Analysis & Forecasting online publication.