


Proprietary System Shows Stock Market Rally Could Extend Higher
Stock-Markets / Stock Markets 2018 Jul 23, 2018 - 09:48 AM GMTBy: Chris_Vermeulen

 The following Weekly charts are illustrations of one of our proprietary price modeling systems that shows trends, market breadth and much more. We use this almost exclusively on longer-term (Weekly, Monthly, and Quarterly charts) to help us understand where longer-term support and resistance levels are, where the market ranges are truly important and to determine true market breadth. When we are studying Daily chart or intra-day charts – the shorter term price rotation can often clutter our interpretation of the long term expectations. Yes, we have other modeling systems, predictive analysis systems, Fibonacci systems, Adaptive Cycles systems and more. Our collection of proprietary analysis tools is very deep. Yet, one has to know how to use these tools and what value they can provide at different times.
This proprietary modeling system is designed to model price swings/rotation and provide clear overall objective analysis of key price levels/pivots. We call it “TT Charger”.
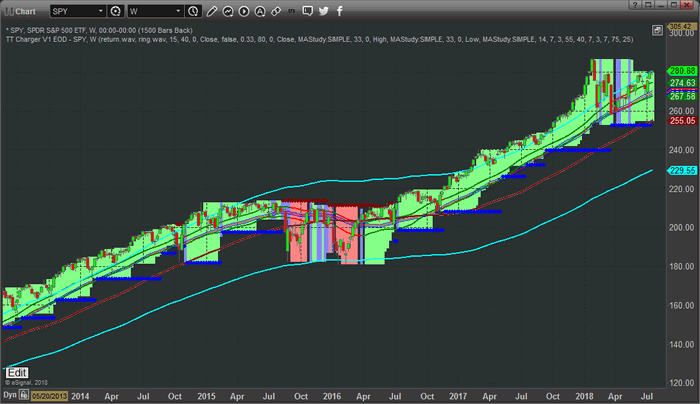
WEEKLY CHART OF THE SPY USING OUR TT CHARGER MODELING SYSTEM
This first Weekly chart of the SPY using our TT Charger modeling system is clearly still bullish. The price breadth contracting a bit near the current prices and support is currently functioning near $252. The current market price has recently broken higher above the short term price channels in addition to the longer term price channels. This is a pretty good indication that price may attempt another rally attempt that may extend for many weeks. In 2017, we witnessed more than 5 to 15+ weeks of extended price rally above both of these channel levels at times. The recent rotation in February 2018 may operate as a “recharging of price” in terms of a future rally attempt.
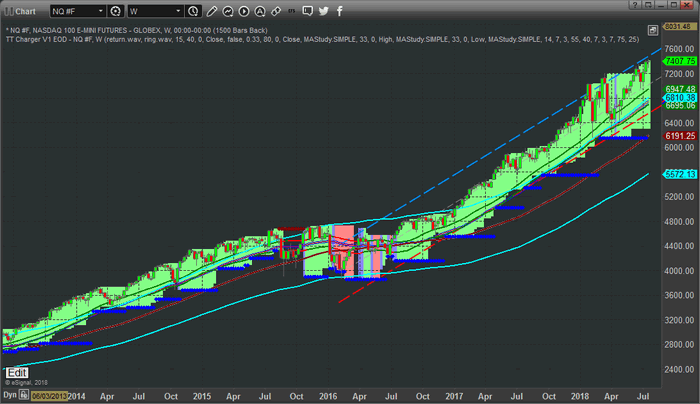
WEEKLY NQ CHART WITH THE TT CHARGER
This Weekly NQ chart with the TT Charger applied for shows an even more incredible setup. Support is currently setting near $6190 and price has extended beyond both of the price channels for more than 11 weeks now. Market Breadth is expanding, therefore the implied volatility is increasing as well. Although we may not see a very big volatility rotation in price, the capability of increased volatility is still valid.
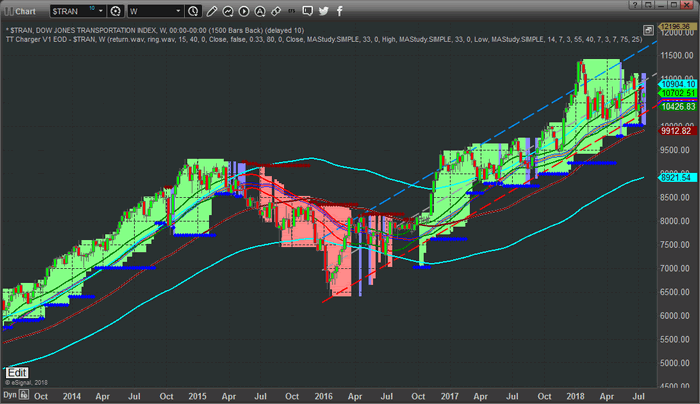
WEEKLY TRANSPORTATION INDEX CHART
This Weekly Transportation Index chart paints a clearer picture of the struggling Transportation Index in terms of the recent price rotation. The TT Charger analysis still shows a solidly bullish price trend with support at $10,005. Price is within the longer term price channels and just above the shorter term price channel. The Transportation index typically leads the US equities markets by about 4~8 months, so it is important that we see the Transportation index rally in support of the equities markets rally. If this fails to happen, then we are likely experiencing a “capital appreciation” that is not supported by economic fundamentals. In other words, without a rally in the Transports, any price advance in the equities markets is likely short-lived (3~6 months at best) before one of the two will break.
At this point, our interpretation of these charts is that the US earnings season should drive equities prices higher, within and above these price channels, and create a real opportunity for investors/traders. Yes, support is quite a bit below the current price levels, but these support models will adjust as price advances. Unless a reversal trigger is generated, which does not seem likely right now, or the support levels are broken, which is not likely right away, we should be looking for advancing prices and breakout rallies over the next few weeks or months.
Our members have access to much greater insight and analysis than we can share with the general public. We reserve our most advanced price modeling systems, predictive analysis and research for our exclusive membership levels. We are warning you that a massive upside swing is about to setup and you’ll want to be prepared for it because this could be a true “once in a lifetime” type of move. We also urge you to consider joining www.TheTechnicalTraders.com as a member to receive all of our detailed updates, daily videos, trading signals and more. If you don’t believe we can assist you in your future with our research, analysis and other features and benefits, you can cancel your subscription and move onto something else.
Either way, we urge you to be prepared for this next move higher and take a few minutes to read over our most recent public research posts at www.TheTechnicalTraders.com/FreeMarketResearch/.
Chris Vermeulen
www.TheTechnicalTraders.com
Chris Vermeulen has been involved in the markets since 1997 and is the founder of Technical Traders Ltd. He is an internationally recognized technical analyst, trader, and is the author of the book: 7 Steps to Win With Logic
Through years of research, trading and helping individual traders around the world. He learned that many traders have great trading ideas, but they lack one thing, they struggle to execute trades in a systematic way for consistent results. Chris helps educate traders with a three-hour video course that can change your trading results for the better.
His mission is to help his clients boost their trading performance while reducing market exposure and portfolio volatility.
He is a regular speaker on HoweStreet.com, and the FinancialSurvivorNetwork radio shows. Chris was also featured on the cover of AmalgaTrader Magazine, and contributes articles to several leading financial hubs like MarketOracle.co.uk
Disclaimer: Nothing in this report should be construed as a solicitation to buy or sell any securities mentioned. Technical Traders Ltd., its owners and the author of this report are not registered broker-dealers or financial advisors. Before investing in any securities, you should consult with your financial advisor and a registered broker-dealer. Never make an investment based solely on what you read in an online or printed report, including this report, especially if the investment involves a small, thinly-traded company that isn’t well known. Technical Traders Ltd. and the author of this report has been paid by Cardiff Energy Corp. In addition, the author owns shares of Cardiff Energy Corp. and would also benefit from volume and price appreciation of its stock. The information provided here within should not be construed as a financial analysis but rather as an advertisement. The author’s views and opinions regarding the companies featured in reports are his own views and are based on information that he has researched independently and has received, which the author assumes to be reliable. Technical Traders Ltd. and the author of this report do not guarantee the accuracy, completeness, or usefulness of any content of this report, nor its fitness for any particular purpose. Lastly, the author does not guarantee that any of the companies mentioned in the reports will perform as expected, and any comparisons made to other companies may not be valid or come into effect.
Chris Vermeulen Archive |
© 2005-2022 http://www.MarketOracle.co.uk - The Market Oracle is a FREE Daily Financial Markets Analysis & Forecasting online publication.