Stock Market Trend and Volatility Analysis
Stock-Markets / Stock Markets 2018 Aug 06, 2018 - 11:58 AM GMTBy: Nadeem_Walayat
This is part 4 of my stock market in-depth analysis that seeks to conclude in a detailed trend forecast for the whole of the remainder of 2018
- Part 1 - Trumponomics Stock Market 2018 - The Manchurian President
- Part 2 - The Inflationary Exponential Stocks Bull Market
- Part 3 - Dow Stock Market Elliott Wave Analysis
The whole of this analysis that includes my detailed trend forecast was first made available to Patrons who support my work. To get immediate First Access to ALL of my analysis and trend forecasts then do consider becoming a Patron by supporting my work for as little as just $3 per month. https://www.patreon.com/Nadeem_Walayat.
TREND ANALYSIS

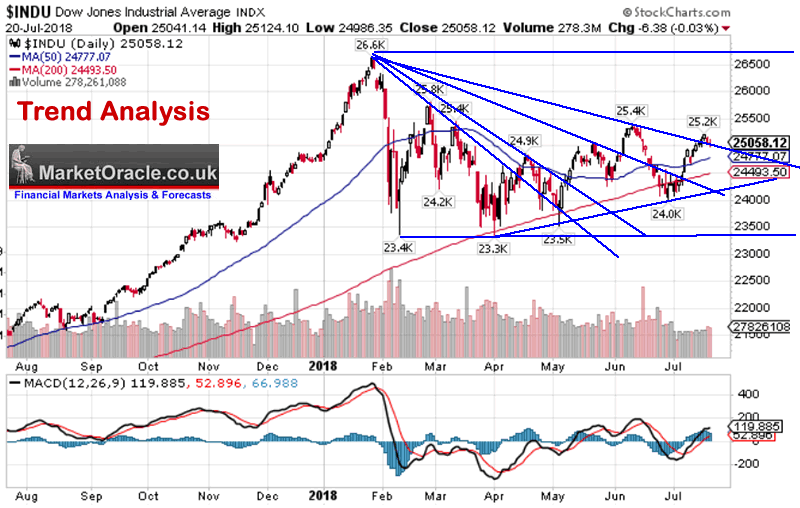
The Dow is clearly stuck in a trading range where each break of a resistance trend line fails to trigger an assault on the 26,600 high. Furthermore until quite recently the risks to the Dow were on the downside. Which has improved since May when the Dow has been showing signs of leaving the sub 24k levels behind and thus implies is targeting a trend towards 26,600.
RESISTANCE : There is heavy over head resistance from 25,200 all the way to 25,800. Beyond which lies the all time high of 26,600.
SUPPORT is along a series of higher lows off of the April low of 23,300. With nearest support at 24,000 rising to 24,200.
TREND CHANNELS - There is an emerging trend channel along the 24,900 and 25,400 highs that gives the Dow a weak upward bias.
Overall trend analysis paints a picture of a market stuck in a trading range with an upward bias with no signs for an imminent breakout higher. With the immediate trend implying a marginal correction lower.
MACD - The MACD is fairly neutral, which similarly to trend analysis suggests that the Dow is in corrective mode implying an immediate term correction lower.

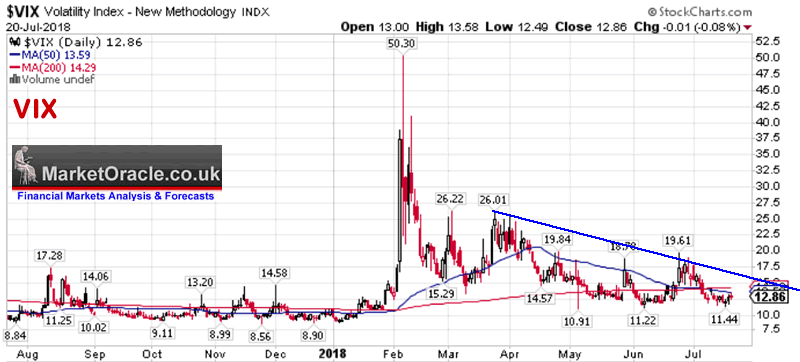
VIX - Since the early year stocks plunge the VIX has gradually become calmer with each passing correction which does appear to be laying the groundwork for an stock advance higher. So the Trade War does not appear to be worrying the stock market yet.
Next > Yield Curve Inversion
Part 5 will be published shortly as my core analysis and detailed trend forecasts are first made available to Patrons who support my work. To get immediate and First Access to ALL of my analysis and trend forecasts then do consider becoming a Patron by supporting my work for as little as just $3 per month. https://www.patreon.com/Nadeem_Walayat
Your analyst,
Nadeem Walayat
Copyright © 2005-2018 Marketoracle.co.uk (Market Oracle Ltd). All rights reserved.
Nadeem Walayat has over 30 years experience of trading derivatives, portfolio management and analysing the financial markets, including one of few who both anticipated and Beat the 1987 Crash. Nadeem's forward looking analysis focuses on UK inflation, economy, interest rates and housing market. He is the author of five ebook's in the The Inflation Mega-Trend and Stocks Stealth Bull Market series that can be downloaded for Free.
 Nadeem is the Editor of The Market Oracle, a FREE Daily Financial Markets Analysis & Forecasting online publication that presents in-depth analysis from over 1000 experienced analysts on a range of views of the probable direction of the financial markets, thus enabling our readers to arrive at an informed opinion on future market direction. http://www.marketoracle.co.uk
Disclaimer: The above is a matter of opinion provided for general information purposes only and is not intended as investment advice. Information and analysis above are derived from sources and utilising methods believed to be reliable, but we cannot accept responsibility for any trading losses you may incur as a result of this analysis. Individuals should consult with their personal financial advisors before engaging in any trading activities.
Nadeem Walayat Archive |
© 2005-2022 http://www.MarketOracle.co.uk - The Market Oracle is a FREE Daily Financial Markets Analysis & Forecasting online publication.


