


Can EUR/JPY Recover Further in September 2018?
Currencies / Euro Aug 28, 2018 - 07:55 PM GMTBy: FXOpen

The daily chart of EUR/JPY suggests that the pair formed a decent support recently and corrected higher. However, it is now approaching significant resistance at 130.60, above which there could be more gains.
Key Points
- The Euro found support near the 124.90-125.00 zone and recovered nicely against the Japanese Yen.
- The EUR/JPY pair is now approaching a crucial bearish trend line with resistance at 130.50 on the daily chart.
EUR/JPY Technical Analysis
The Euro declined sharply from the 131.00 swing high during the first week of August 2018 against the Japanese Yen. The EUR/JPY pair dropped heavily and broke the 129.00, 128.00 and 126.00 support levels.
The decline was such that the pair also cleared the 125.00 support and settled well below the 50-day simple moving average. A new monthly low was formed at 124.90 where buyers emerged.
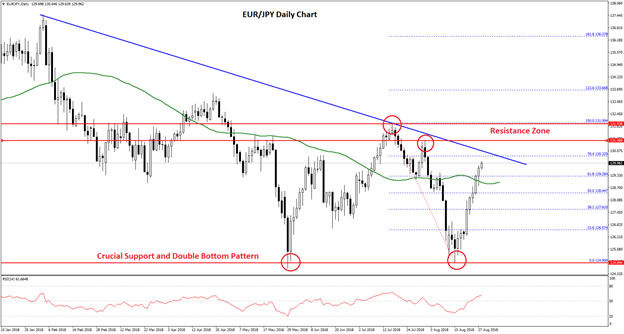
There was a strong bullish reaction from the 124.90-125.00 support area and it seems like the pair formed a double bottom pattern on the daily chart. It climbed higher sharply and broke the 128.00 resistance zone.
There was even a break above the 61.8% Fib retracement level of the last decline from the 131.99 high to 124.90 low. The pair settled above the 129.00 level and the 50-day SMA.
However, there is a significant resistance waiting near the 130.50 level and a bearish trend line with resistance on the same chart. Moreover, the 76.4% Fib retracement level of the last decline from the 131.99 high to 124.90 low is placed near 130.32.
If EUR/JPY manages to break the 130.50 resistance and the bearish trend line, it could test the 131.10/90 pivot zone. Should there be a close above 132.00, the pair may possibly surge towards the 134.00 and 135.00 levels.
On the flip side, a failure to clear the 130.50 and 131.10 resistances might ignite a fresh downside move. Supports on the downside are 129.00, 50-day SMA, 128.50 and 127.00.
The market outlook is provided by FXOpen broker.
FXOpen - true ECN/STP Forex and cryptocurrency broker.
© 2018 Copyright FXOpen - All Rights Reserved Disclaimer: The above is a matter of opinion provided for general information purposes only and is not intended as investment advice. Information and analysis above are derived from sources and utilising methods believed to be reliable, but we cannot accept responsibility for any losses you may incur as a result of this analysis. Individuals should consult with their personal financial advisors.
© 2005-2022 http://www.MarketOracle.co.uk - The Market Oracle is a FREE Daily Financial Markets Analysis & Forecasting online publication.