


Elliott Wave Analysis of TWM (ProShares UltraShort Russell 2000)
Stock-Markets / Stock Markets 2018 Aug 29, 2018 - 04:24 PM GMT

The recent gyrations between Jun – Aug 2018 appear to count well enough as a running triangle. For those readers that have some knowledge of Elliott Wave, will note that a triangle is a very common pattern for a 4th wave of an impulse wave. I am counting the current decline from April 2018 as a 5th wave of a larger impulse wave that started from the 2016 highs (2016 lows on the Russell 2000).
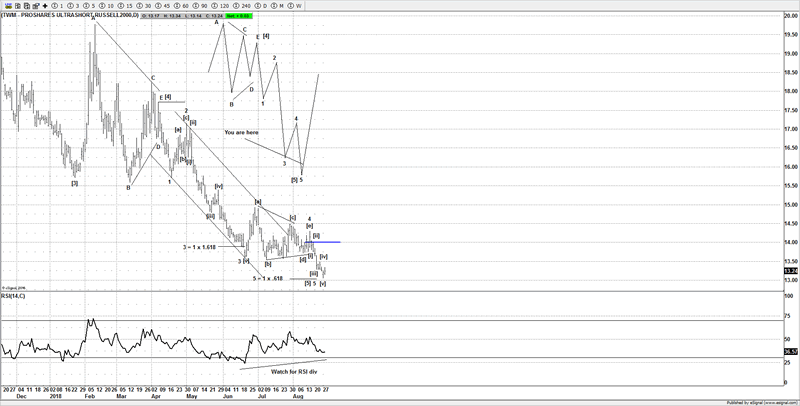
It’s possible to now count a completed thrust from a 4th wave triangle, although until we see a strong move back above 14.00, then wave 5 of wave [5] may still extend lower. A small 5 wave advance on a 15-30 min time frame would be a good sign to support a low in place.
Many people are fearful of bearish ETFS as they seldom like to trade the markets on the short side; I personally think the bearish ETFS have a role to play in the markets provided that you can time your entries as close as you can to major turns in the markets. This is where Elliott Wave can offer an advantage over other forms of technical analysis, whilst Elliott Wave is not perfect; I still feel it’s an edge in the current environment.
In Bear markets, the bearish ETFS will play a major role. If the current move on the Russell 2000 is the culmination to the advance from the 2016 lows, then as the Russell 2000 declines, TWM will rally. So even if you did not want to directly sell short the Russell 2000, buying some TWM could also be used as a hedging position against any bullish positions you may have.
Until we see a strong move above 14.00 on TWM, then traders need to respect the current strength on the Russell 2000, but if the current idea on TWM is correct, then I am expecting a strong move lower on the Russell 2000 soon, so by default a rally on TWM.
Until next time,
Have a profitable week ahead.
Click here to become a member
You can also follow us on twitter
What do we offer?
Short and long term analysis on US and European markets, various major FX pairs, commodities from Gold and silver to markets like natural gas.
Daily analysis on where I think the market is going with key support and resistance areas, we move and adjust as the market adjusts.
A chat room where members can discuss ideas with me or other members.
Members get to know who is moving the markets in the S&P pits*
*I have permission to post comments from the audio I hear from the S&P pits.
If you looking for quality analysis from someone that actually looks at multiple charts and works hard at providing members information to stay on the right side of the trends and making $$$, why not give the site a trial.
If any of the readers want to see this article in a PDF format.
Please send an e-mail to Enquires@wavepatterntraders.com
Please put in the header PDF, or make it known that you want to be added to the mailing list for any future articles.
Or if you have any questions about becoming a member, please use the email address above.
If you like what you see, or want to see more of my work, then please sign up for the 4 week trial.
This article is just a small portion of the markets I follow.
I cover many markets, from FX to US equities, right the way through to commodities.
If I have the data I am more than willing to offer requests to members.
Currently new members can sign up for a 4 week free trial to test drive the site, and see if my work can help in your trading and if it meets your requirements.
If you don't like what you see, then drop me an email within the 1st 4 weeks from when you join, and ask for a no questions refund.
You simply have nothing to lose.
By Jason Soni AKA Nouf
© 2018 Copyright Jason Soni AKA Nouf - All Rights Reserved
Disclaimer: The above is a matter of opinion provided for general information purposes only and is not intended as investment advice. Information and analysis above are derived from sources and utilising methods believed to be reliable, but we cannot accept responsibility for any losses you may incur as a result of this analysis. Individuals should consult with their personal financial advisors.
© 2005-2022 http://www.MarketOracle.co.uk - The Market Oracle is a FREE Daily Financial Markets Analysis & Forecasting online publication.