Silver DSLV 3X Short ETF Chartology
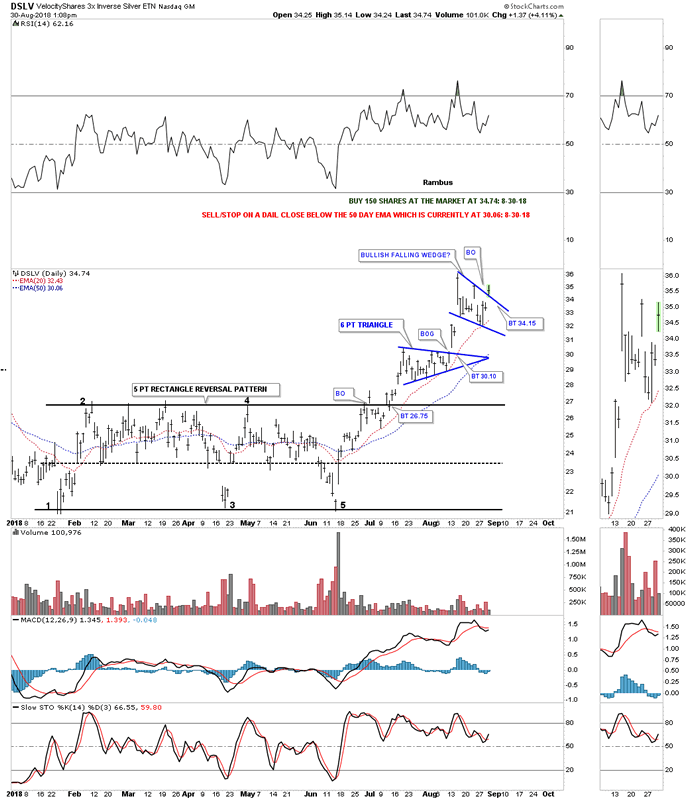
Commodities / Gold and Silver Stocks 2018 Sep 01, 2018 - 09:58 AM GMT Today DSLV 3 X short silver etf, is breaking out from a possible bearish falling wedge. I’m going to take an initial position and buy 150 shares at the market at 34.74 with the sell/stop on a daily close below the 50 day ema which is currently at 30.06. ZSL is a 2 X leveraged etf if you don’t want all the leverage. DSLV can be pretty volatile so take small bites. A backtest to the top rail would come into play around the 34.15 area for a slightly lower risk entry point.

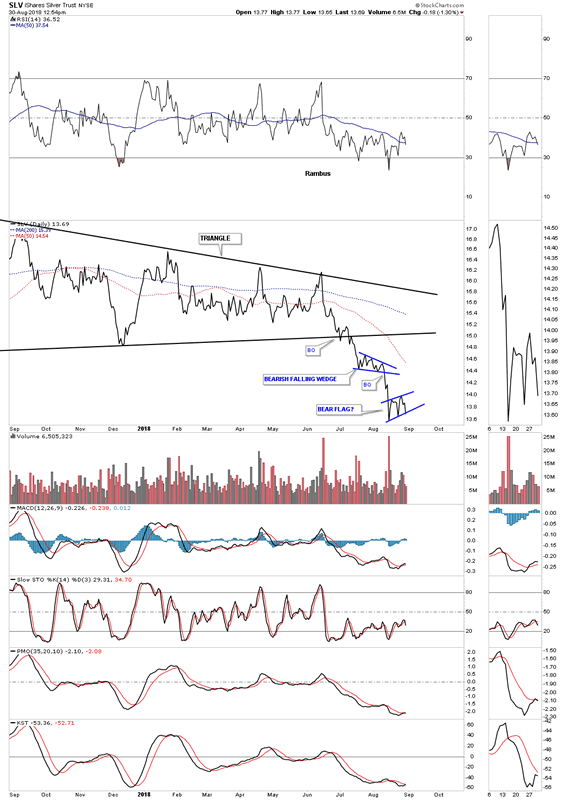
Below is a daily line chart for SLV which shows a possible bear flag forming.

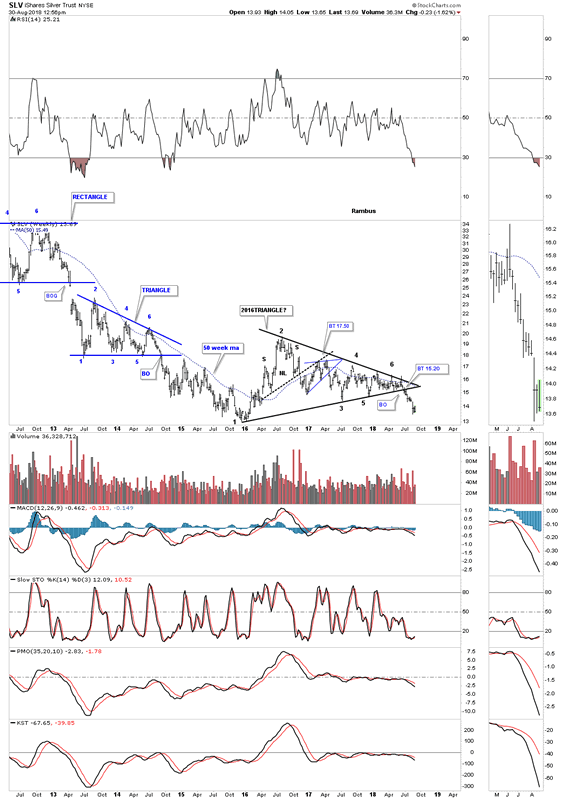
The weekly chart for SLV shows a similar 2016 triangle to the one we’ve been following on gold. Keep in mind the dominate chart pattern is the 2 1/2 year triangle which is releasing its energy to the downside.

All the best
By Rambus Chartology
FREE TRIAL - http://rambus1.com/?page_id=10
© 2018 Copyright Rambus- All Rights Reserved
Disclaimer: The above is a matter of opinion provided for general information purposes only and is not intended as investment advice. Information and analysis above are derived from sources and utilising methods believed to be reliable, but we cannot accept responsibility for any losses you may incur as a result of this analysis. Individuals should consult with their personal financial advisors.
© 2005-2022 http://www.MarketOracle.co.uk - The Market Oracle is a FREE Daily Financial Markets Analysis & Forecasting online publication.


