Hindenburg Omen & Consumer Confidence: More Signs of Stock Market Trouble in 2019
Stock-Markets / Stock Markets 2018 Sep 15, 2018 - 09:09 AM GMTBy: Troy_Bombardia
Our Long Term Risk Model suggests that the U.S. economy & bull market are almost at the point at which “things can’t get much better”, but we’re not completely there yet.
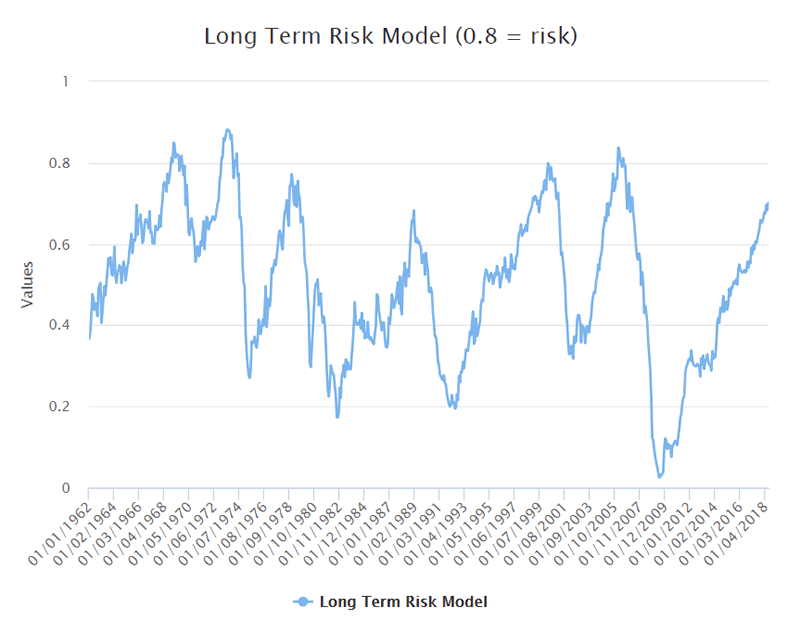
The stock market should be fine throughout the rest of 2018, but we are getting more and more signs that the stock market will make a major top in 2019.
Consumer Confidence
The Confidence Board’s latest Consumer Confidence reading demonstrates that consumers are extremely optimistic right now.
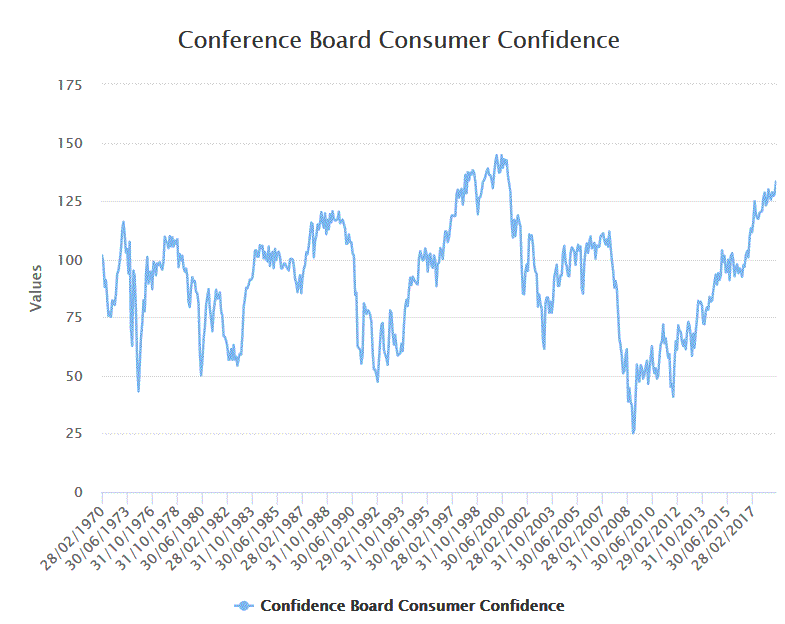
The last time consumers became this confident was in December 1997. The U.S. stock market (S&P 500) began a “big correction” less than 7 months later in July 1998.
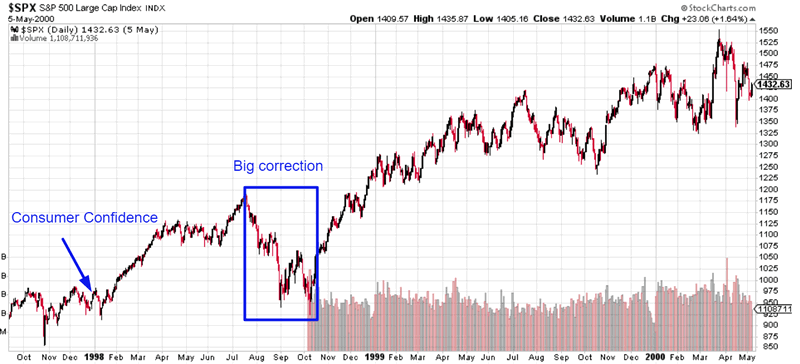
This suggests that the U.S. stock market will make a major top in 2019: either a “big correction” or the start of a bear market. The Medium-Long Term Model suggests that the next major top will be a bear market start instead of a “big correction”.
Hindenburg Omen
The Hindenburg Omen is essentially a breadth indicator. It measures diverging breadth during a stock market rally.
Conventional trading wisdom is based on the idea that when the stock market is going up, most stocks should be making 52 week highs together. The Hindenburg Omen notes that a problem is brewing under the rally because A LOT of stocks are making 52 week highs (going up) while A LOT of stocks are making 52 week lows (going down) at the same time. In other words, breadth is diverging.
There’s a Hindenburg Omen for the NYSE and a Hindenburg Omen for the NASDAQ. Over the past 6 trading days, there have been a combined 8 Hindenburg Omen signals (from NYSE and NASDAQ).
This is extremely rare and has only happened 3 times in history:
- September 11 2018 (current case)
- December 10 2014
- December 16 1999
- July 6 1990
In all of these 6 historical cases, the S&P 500 began a “big correction” or bear market within the next 6 months.
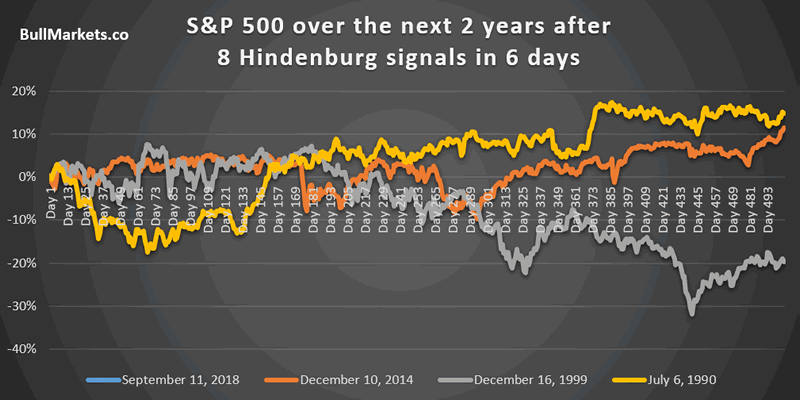
Here are the cases in detail
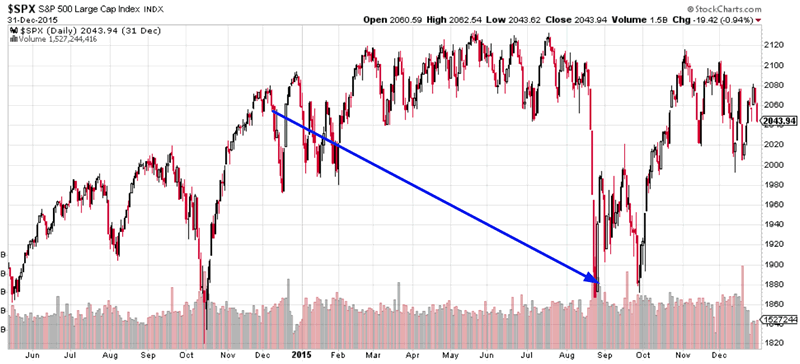
December 10 2014
The S&P began a “big correction” 6 months later.
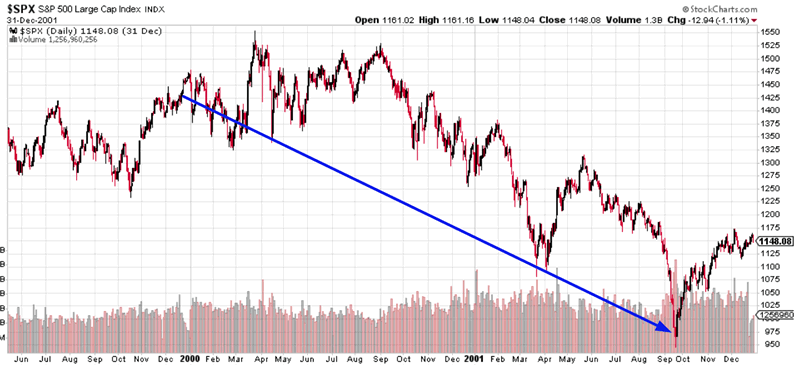
December 16 1999
The S&P made a bull market top 4-10 months later (flat top from March-September 2000)
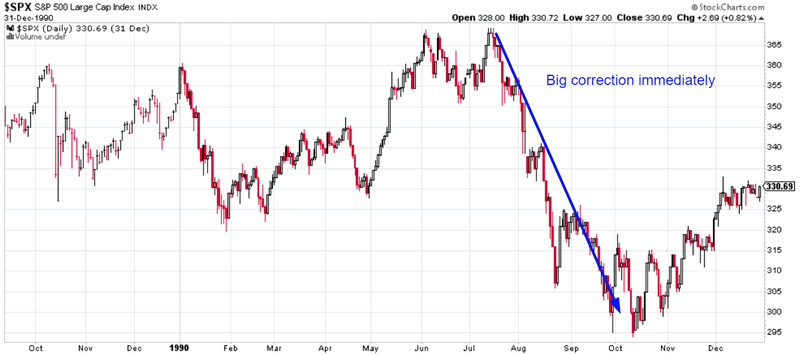
July 6 1990
The S&P immediately began a “big correction”.
As you can see, this Hindenburg Omen seems like a bearish sign for the stock market. Either a bear market or “big correction” begins within the next 6 months.
However, a part of me wonders how useful the Hindenburg Omen is.
Why are “many stocks” in the NYSE making 52 week highs while “many stocks” make 52 week lows right now?
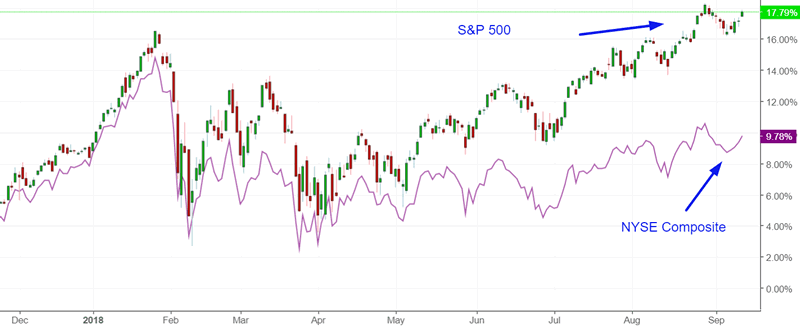
It’s because the NYSE doesn’t just represent American stocks: there are a lot of foreign listed stocks on the NYSE. Foreign stocks have cratered this year while the U.S. stock market is rallying. Hence, the Hindenburg Omen doesn’t represent diverging breadth in U.S. stocks. It represents the divergence between U.S. stocks and foreign (e.g. emerging market) stocks.
This is also why the NYSE Composite – a composite covering all the commonly traded stocks on the NYSE – has lagged the S&P 500 significantly. 55 of the 100 largest stocks in the NYSE are foreign (non-U.S.) stocks.
So in reality, the Hindenburg Omen isn’t necessarily saying that there’s a big breadth divergence in the U.S. stock market. It’s saying that there’s a big divergence in the NYSE: one component which are U.S. stocks and one component which are foreign stocks.
Conclusion
We’re starting to get more signs (here and here) that the stock market will make a major top in 2019. It’s too early to turn bearish right now, but be careful next year.
Click here for more market studies.
By Troy Bombardia
I’m Troy Bombardia, the author behind BullMarkets.co. I used to run a hedge fund, but closed it due to a major health scare. I am now enjoying life and simply investing/trading my own account. I focus on long term performance and ignore short term performance.
Copyright 2018 © Troy Bombardia - All Rights Reserved
Disclaimer: The above is a matter of opinion provided for general information purposes only and is not intended as investment advice. Information and analysis above are derived from sources and utilising methods believed to be reliable, but we cannot accept responsibility for any losses you may incur as a result of this analysis. Individuals should consult with their personal financial advisors.
© 2005-2022 http://www.MarketOracle.co.uk - The Market Oracle is a FREE Daily Financial Markets Analysis & Forecasting online publication.


