US and Global Stocks, Commodities, Precious Metals and the ‘Anti-USD’ Trade
Stock-Markets / Financial Markets 2018 Sep 23, 2018 - 04:43 PM GMTBy: Gary_Tanashian
 The most recent leg of the US stock market rally and the bounces in global equities, commodities and precious metals are coming as part of an “anti-USD trade”. Certain US stock sectors, most global stock markets, commodities and precious metals were pressured by the USD rally that began in April and now, as the buck eases, a relief valve opens.
All charts below are as of Thursday’s close.
US – S&P 500
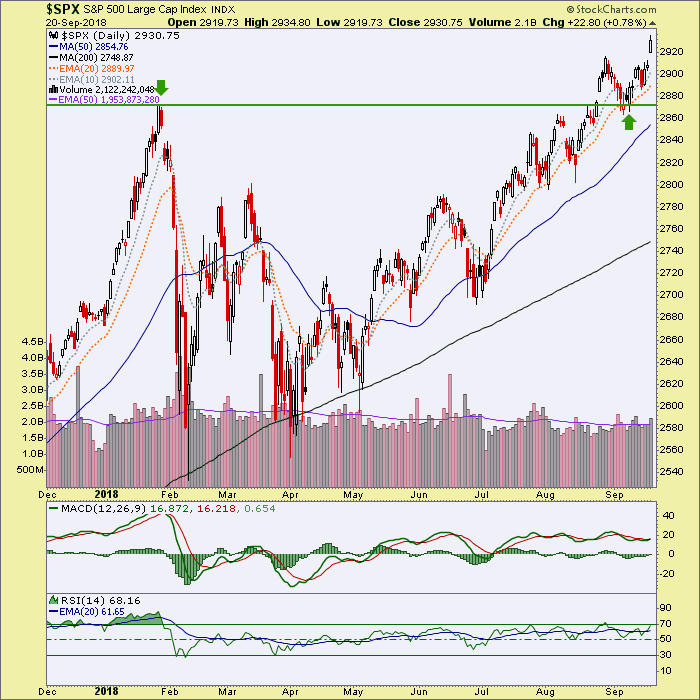
The S&P 500 – in essence a collection of sectors that are ‘pro’, ‘anti’ and ‘neutral’ the USD’s status – appears to be on the way to our target of 3000+, based on a conservative measurement of its daily chart pattern. This was the NFTRH alternate scenario after our expected summer drive to test the January top did not prove out a then favored view that the test would fail. As you can see, SPX broke out, dropped to test the breakout and off it goes. We have since been operating to the new favored plan.
It is logical that US stocks would not decline on balance if the USD weakened. That is because a key goal of fiscal policy since the 2016 election is reflation, which would have a weak USD as a component.
Global Stocks – ACWX
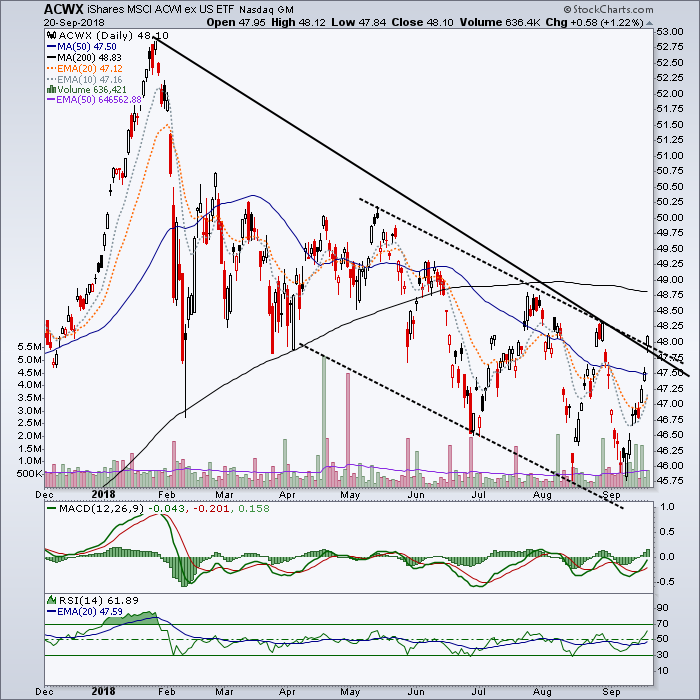
Global stocks (ex-US) are threatening to break a trend line from the January high. Easy on the excitement just yet, the 200 day moving average is rolling over and the 50 day is trending down. But a continued rally looks likely if USD continues to roll over. As it stands now, even this strong bounce shows why I covered a short last week on my largest position, which was against this ETF. I did not want to incur even the hard bounce, which has unfolded.
As with US sectors, there are those global markets that are more and less sensitive to the USD. The Trade War (food fight) between the US and China has distorted some of these relationships a bit, but generally Emerging Markets are seen as prime beneficiaries should the USD continue to weaken.
As an aside, we noted in NFTRH 517 that the Japanese Nikkei had gone bullish again, as the Yen has weakened. This year’s currency battles appear to be taking place between the US dollar, the Euro and the Yuan, along with the associated trade tensions. Normal relationships between currency status and local stock market status appear temporarily distorted. But this is a topic for a whole other article.
Commodities
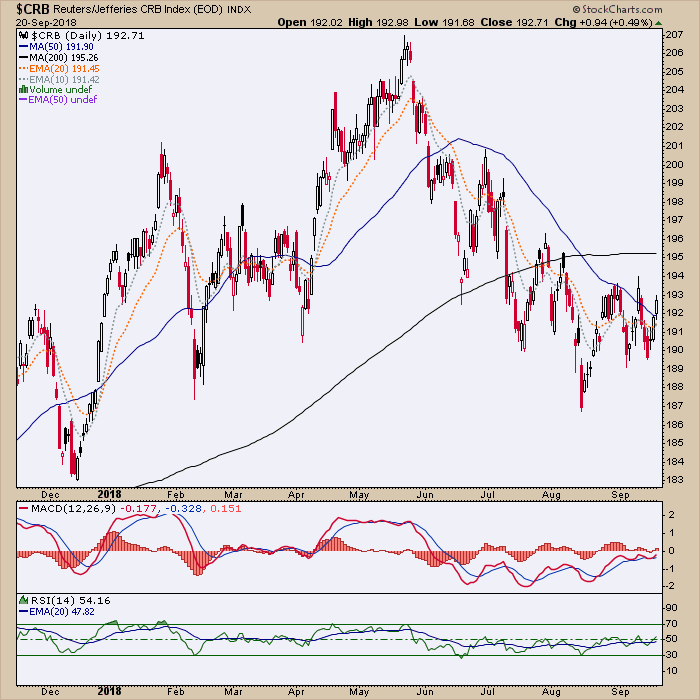
CRB has been whipsawing up and down but is in a potential bounce pattern.
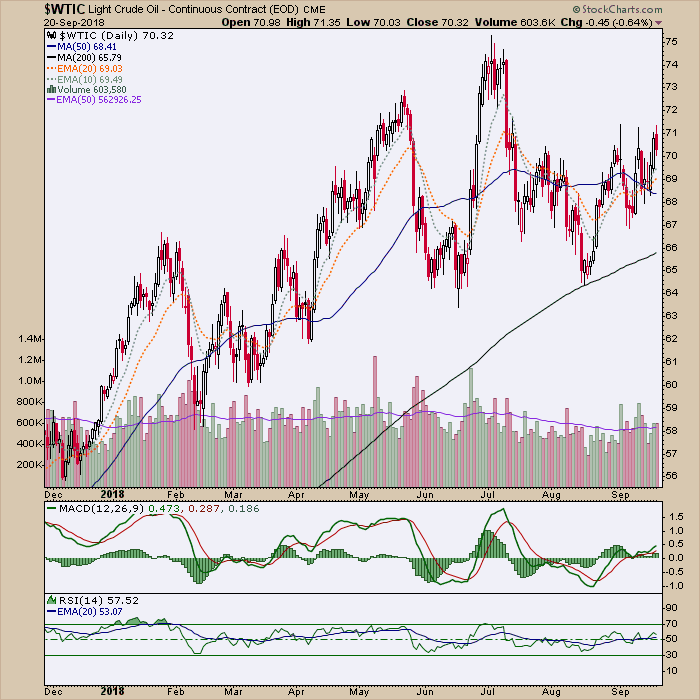
Among the items lending relative strength has been crude oil, which has formed a pattern of its own from a relatively more bullish point as the SMA 200 trends up and the SMA 50 trends sideways.
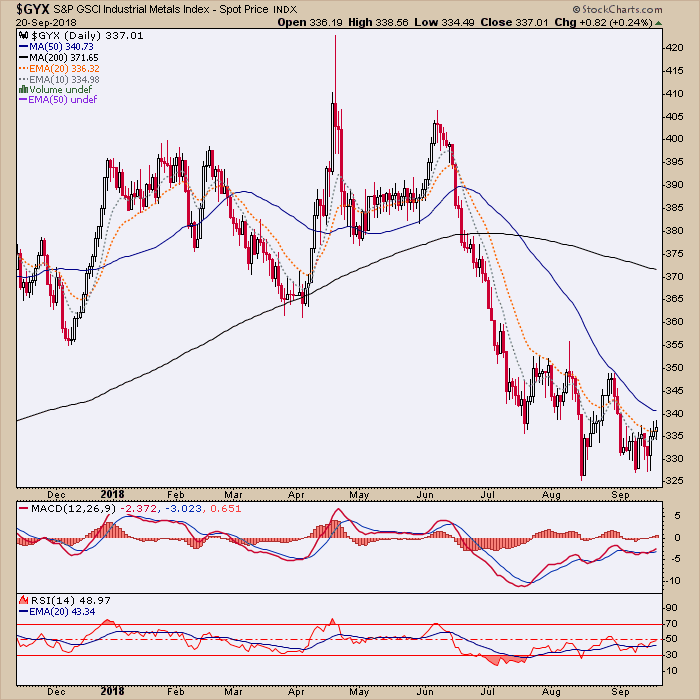
Among the weaker items have been the Industrial Metals, which do have positive MACD and RSI divergences in play. This class of commodities has been directly in the cross hairs of the US/China Trade War (food fight) and if/as the USD – a prime beneficiary of trade war tensions – continues to pull back, IMs would be a logical bounce candidate.
Precious Metals
Last but not least we have the precious metals, so misunderstood as simply anti-USD and pro-inflation when actually there is so much more to the picture needed to turn the sector bullish for real. The macro fundamental detail required is beyond this article’s scope, but… picture = 1000 words.
The macro fundamentals are not yet lined up, although there may be a few hints brewing, which we’ll cover in NFTRH.

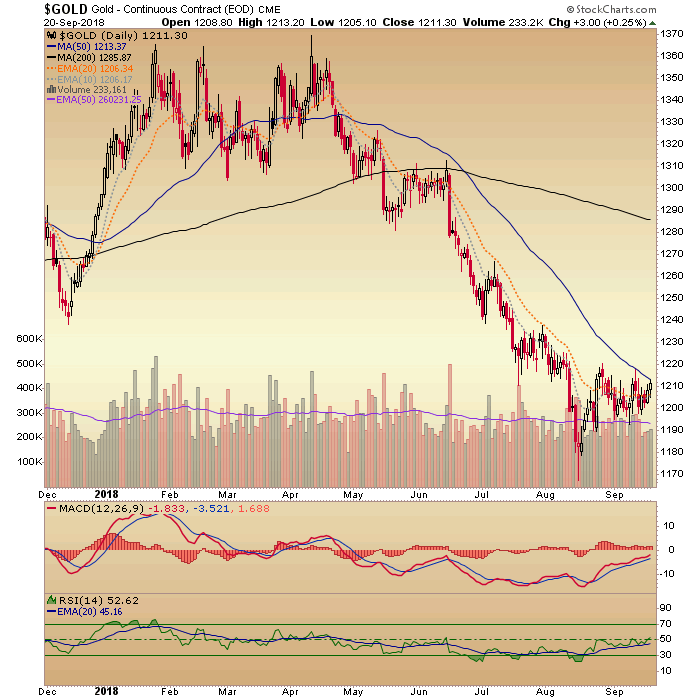
Gold dropped to a support level we had laid out in NFTRH and associated updates using a weekly chart. From there it put on a hard reversal and has since been consolidating at the harshly down sloped SMA 50. We had noted back in July that the seasonal average was becoming positive and in August that the sentiment situation was positive. We’ve also been noting for weeks now that the Commitments of Traders (CoT) situation was very constructive. Hence, bounce potential with a weak USD as the catalyst.
I can’t help but insert a warning that when the gold bug authorities start to fetishize a bearish USD, it would be time to have much caution unless the balance of the macro fundamentals have turned favorable.
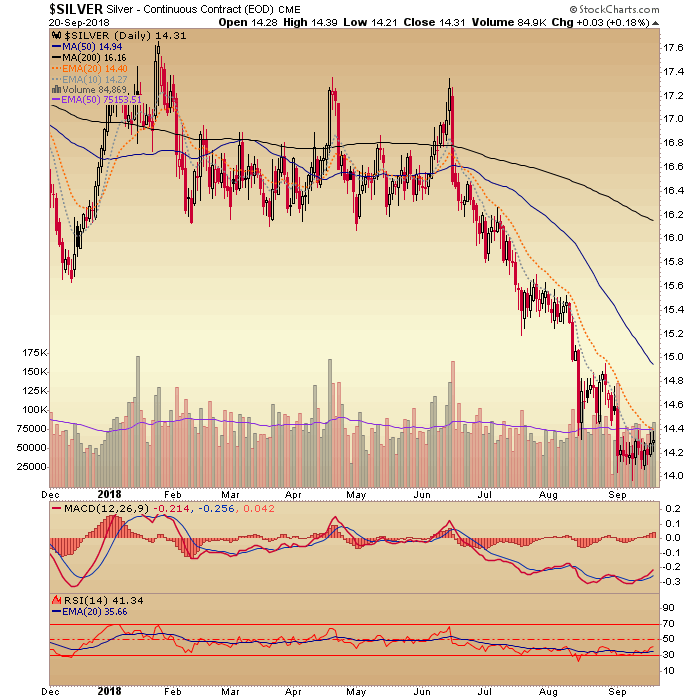
I am long SLV for a ‘price play’ trade (preferring the Silver Bullet to individual silver miners subject to execution and other risks) because when it moves, it moves. But thus far there is no technical sign of a bottom. There is a potential bottom, with positive divergence (not to mention CoT), but no upturn yet. The first indication of that would be a climb above the orange dashed EMA 20, which has held silver down like an anchor since June.
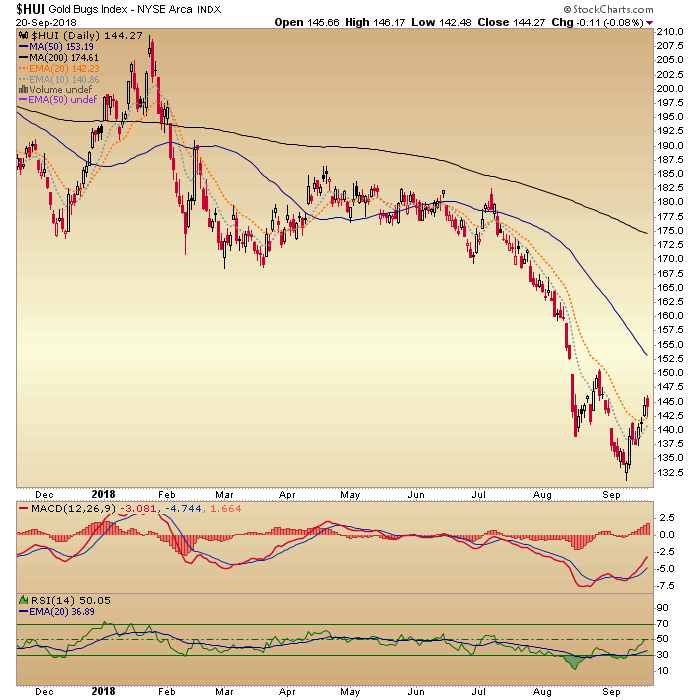
The Gold Bugs index made a lower low to shake ’em out (and get the momo-oriented shorts to bite) but did this with positive divergences on MACD and RSI. And wouldn’t you know, a bounce resulted.
We are managing upside objectives in NFTRH and associated updates, but the main point to remember is that this is currently an ‘anti-USD’ trade and as such, an also-ran among other asset markets. If the planetary macrocosm applies well to gold, it is doubly so to the miners, which leverage the macro fundamentals to the downside and the upside.
Finally my friends, dear old Uncle Buck, the dupe to the current global asset bounce. We have for weeks been watching resistance at the SMA 50 (95) and support around 94, with a breakdown indicating a relief valve for global assets that had been under pressure all summer. Well… boink!
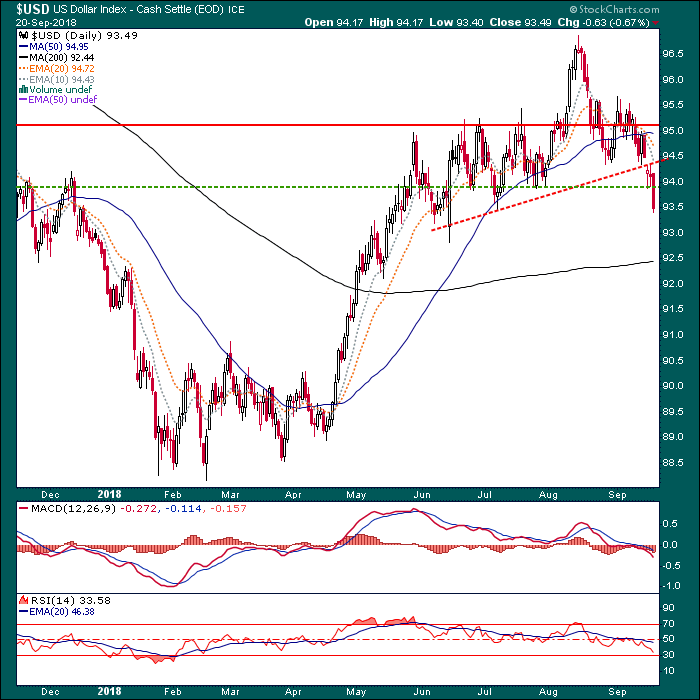
But the US dollar bounced in April from major long-term support that we noted in January while the world was hysterically bearish (and short) USD. For a view of the daily, weekly and monthly (big picture) USD situation check out this post from earlier this week: Uncle Buck Drops, ‘Anti-USD’ Trade Awaiting Green Light.
Bottom Line
We have completed a summer of successful management of an expected S&P 500 drive to test its January top. Our favored plan, which was for a new correction after the top-test did not come about and so we brought forward the alternate, which is an extension to SPX 3000+. But this is coming against a weakening US dollar and now a world of ‘anti-USD’ asset markets are getting some pressure relief.
As global asset markets bounce I’ll ask you to consider the herd and its orientations at all times. The herd hated USD in April, loved it last month and now USD is on a normal pullback. If it becomes abnormal (again, we’ll be managing the parameters all along the way) then prepare to make a lot of money globally, the easy way. If USD is merely taking a healthy pullback (again, see the ‘Uncle Buck Drops…’ link above) prepare to conserve capital.
But most of all, have balance and be prepared to do the work to remain flexible. Autopilot in this market is for the herds and the perma-promoters that tend them.
Subscribe to NFTRH Premium (monthly at USD $33.50 or a 14% discounted yearly at USD $345.00) for an in-depth weekly market report, interim market updates and NFTRH+ chart and trade setup ideas, all archived/posted at the site and delivered to your inbox.
You can also keep up to date with plenty of actionable public content at NFTRH.com by using the email form on the right sidebar and get even more by joining our free eLetter. Or follow via Twitter ;@BiiwiiNFTRH, StockTwits or RSS. Also check out the quality market writers at Biiwii.com.
By Gary Tanashian
© 2018 Copyright Gary Tanashian - All Rights Reserved
Disclaimer: The above is a matter of opinion provided for general information purposes only and is not intended as investment advice. Information and analysis above are derived from sources and utilising methods believed to be reliable, but we cannot accept responsibility for any losses you may incur as a result of this analysis. Individuals should consult with their personal financial advisors.
Gary Tanashian Archive |
© 2005-2022 http://www.MarketOracle.co.uk - The Market Oracle is a FREE Daily Financial Markets Analysis & Forecasting online publication.


