Gold: New Bull Or Same Old Bear?
Commodities / Gold and Silver 2018 Oct 01, 2018 - 01:10 PM GMTBy: Gary_Savage
 There are two schools of thought right now, and both sides are firmly convinced they are correct.
The bullish case: Gold started a new cyclical bull market in late 2015.
The bearish case: The bounce out of the 2015 bottom was just a counter trend bear market rally, and at best gold is stuck in a long sideways channel similar to the 1980-2001 period.
While I have to admit there is a lot of compelling evidence to support the bearish scenario I’m not convinced that is correct.
I’ve noted before that gold tends to move in a distinct ABCD pattern. The A-wave is an aggressive rally out of a major corrective bottom. The B-wave is some form of correction that clears the bullish sentiment produced during the explosive A-wave advance. (B-waves can be rather complex and exhausting). The C-wave is where the gains are made. Then finally the D-wave decline as the C-wave tops and a major correction begins. I’ve shown an example in the next chart of this 4-wave pattern.
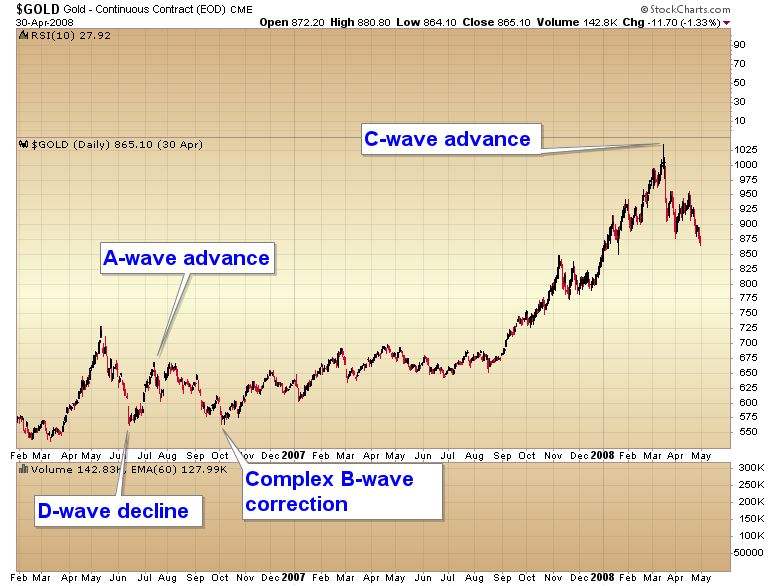
As we have moved through this secular bull market these 4 wave patterns have gotten bigger and taken more time. You can see in the chart above the C-wave advance from October of 2006 to the top in March of 2009 spanned almost 18 months and gained 89%.
The next C-wave advance that began in April of 2009 ran for 29 months and gained 123%.
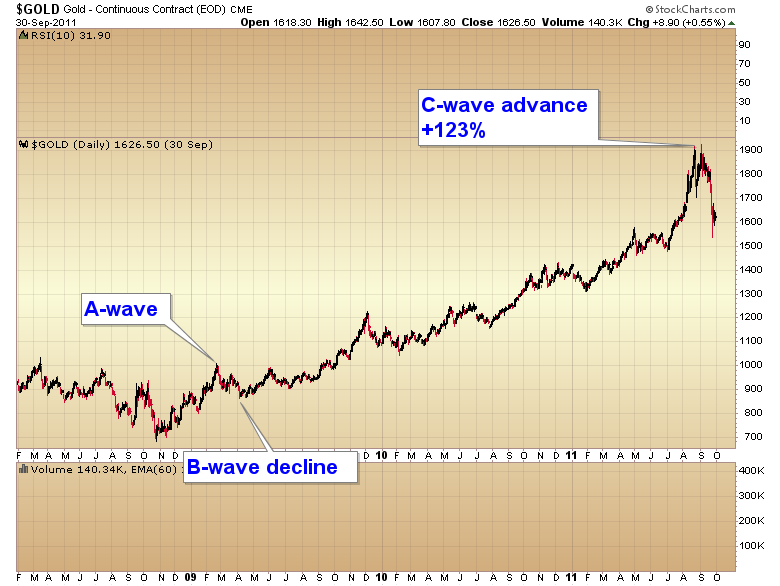
Many traders are convinced that gold is now stuck in a long sideways bear market. I on the other hand tend to think we are stuck in a very complex and frustrating B-wave decline.
The Baby bull rally certainly fit the parameters of an A-wave advance:
Explosive move.
Generated massive bullish sentiment as everyone finally recognized the long bear market was over.
Retraced a significant portion of the previous D-wave decline but didn’t move above the previous C-wave top (in this case back to the 38% Fib).
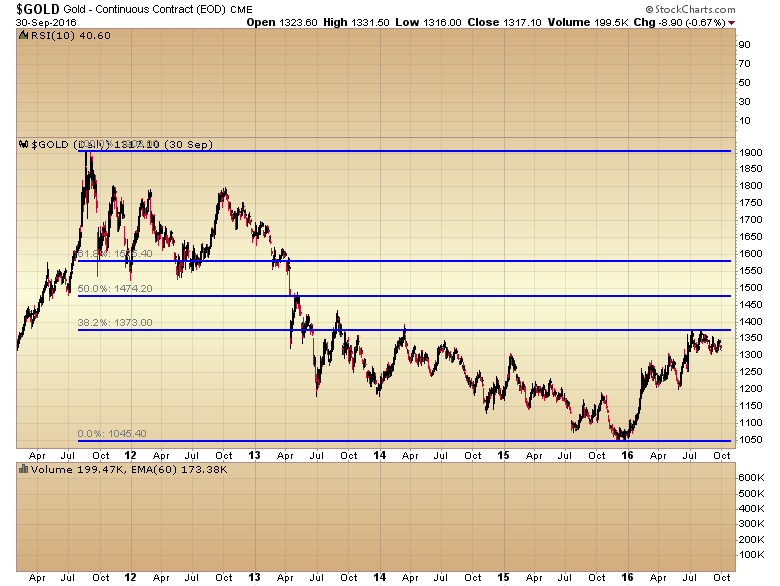
Once the A-wave has topped there is a B-wave decline that washes away the optimism that was generated during the powerful A-wave. This can unfold as either a deep correction that retests the D-wave bottom (but doesn’t drop below it), or it can be a complex frustrating sideways correction that eventually just wears traders out as they were expecting the A-wave to resume quickly.
I’m going to suggest gold has been in the grip of a complex and frustrating B-wave decline ever since the A-wave topped in 2016.
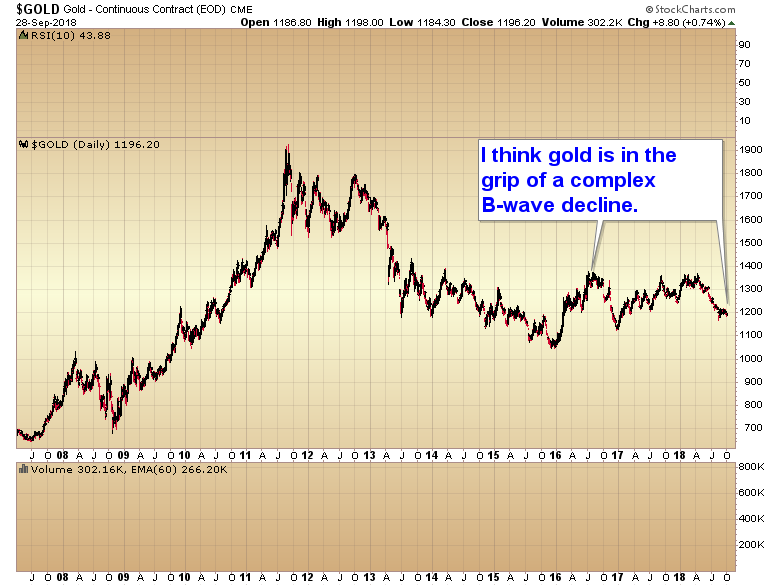
Considering the current daily cycle in gold is left translated it’s not out of the question that we could get one more quick push down over the next couple of weeks to test and marginally break the post election low at 1140 before the B-wave is complete and the next C-wave begins.
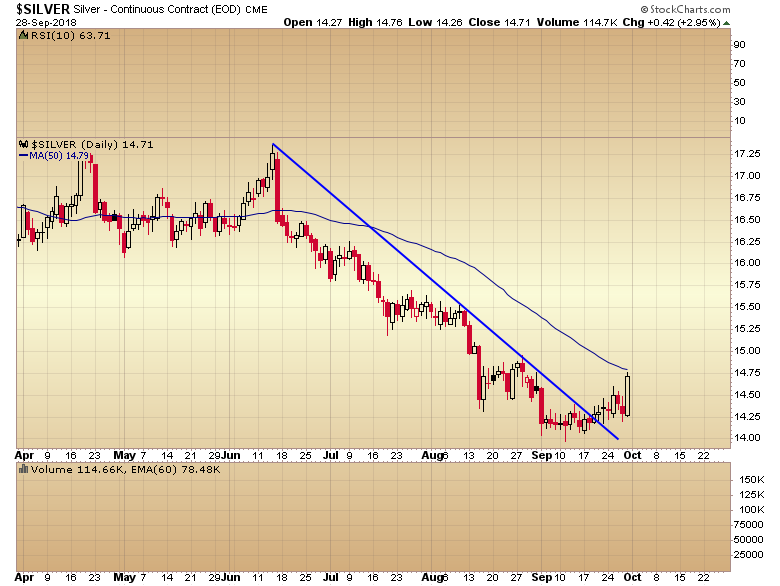
That being said I’m starting to wonder if Palladium, and possibly now silver are already developing shortages and they may diverge from gold if it makes a lower low. The rally on Friday in silver was pretty convincing and it has broken its intermediate trend line.
If silver disconnects from gold and fails to follow it lower that would be a strong signal the B-wave is coming to an end. Next week could confirm this theory if gold continues down but silver ignores it and moves higher.
Like our new Facebook page to stay current on all things Smart Money Tracker
Gary Savage
The Smart Money Tracker
Gary Savage authors the Smart Money Tracker and daily financial newsletter tracking the stock & commodity markets with special emphasis on the precious metals market.
© 2018 Copyright Gary Savage - All Rights Reserved
Disclaimer: The above is a matter of opinion provided for general information purposes only and is not intended as investment advice. Information and analysis above are derived from sources and utilising methods believed to be reliable, but we cannot accept responsibility for any losses you may incur as a result of this analysis. Individuals should consult with their personal financial advisors.
© 2005-2022 http://www.MarketOracle.co.uk - The Market Oracle is a FREE Daily Financial Markets Analysis & Forecasting online publication.


