


Dow Stock Market Analysis
Stock-Markets / Stock Markets 2018 Oct 02, 2018 - 04:26 AM GMTBy: Austin_Galt

Previous analysis updated – price traded higher as outlined, however, the expectation of a secondary high was wrong. On the plus side, this move to record highs has provided clarity going forward and the expectation of a significant decline remains unchanged.
Daily Chart
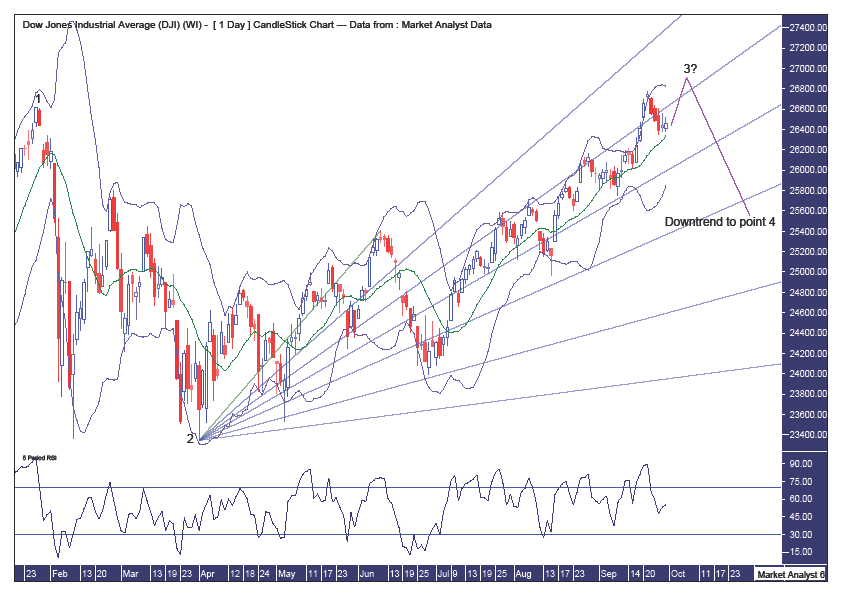
Pattern – in previous analysis I outlined the various broadening top and low formations. They are still in play although I have not included them in this chart. Instead, I wanted to focus on the new broadening top formation that this move to new highs has put in play. I am viewing this current high as a point 3 high with price to reverse back down shortly and head for a point 4 low. There is a new moon on the 9th October so that is some potential timing for a high, give or take a day.
Bollinger Bands – price is back around support from the middle band and I am looking for one final fling to the upside that tops out around resistance from the upper band.
Fibonacci – the 38.2% angle continues to provide good resistance and I favour price to have one final crack at this resistance which ultimately fails and sees price turn back down and begin a downtrend.
RSI – one final high now would likely set up a bearish divergence.
Monthly Chart
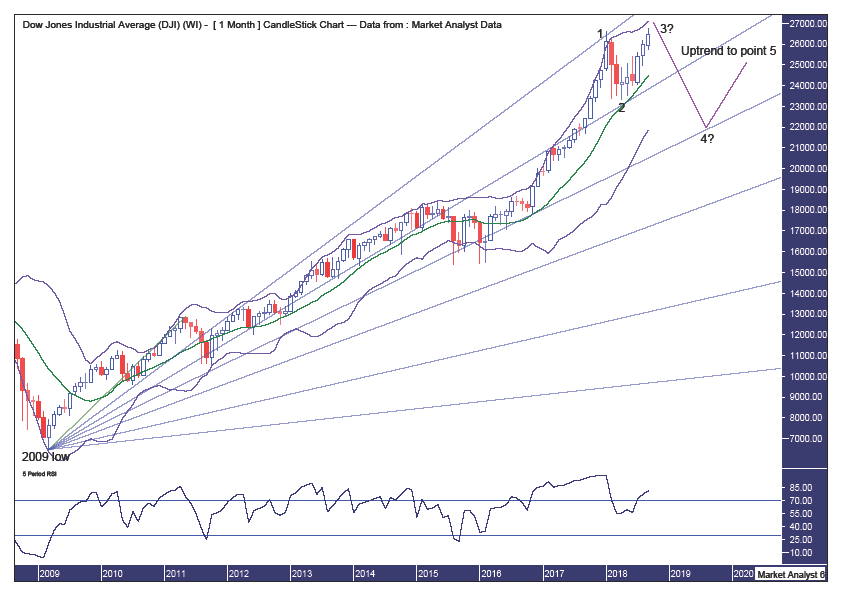
Pattern – we can see more clearly how I expect the 5 point broadening top to shape up.
Bollinger Bands – price looks to be trying to get back to the upper band and this band should be strong resistance. So strong that I expect it to turn price back down.
Fibonacci – the point 1 high was at resistance from the 23.6% angle and this current high should not get back to that angle now, in my opinion. The 50% angle looks like a price target for the point 4 low. Perhaps around the 22000 mark later next year?? We can do more work on this later.
RSI – a bearish divergence will form here.
Logarithmic Yearly Chart
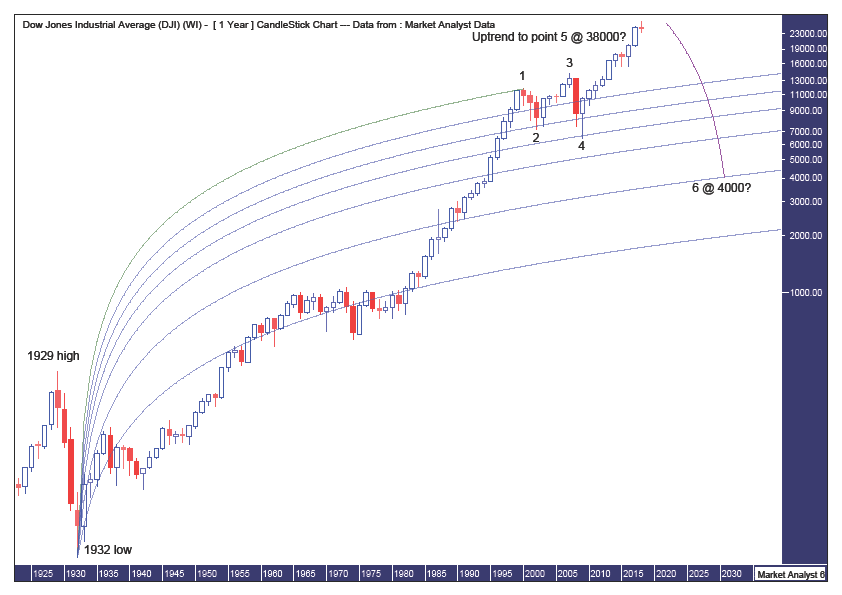
Pattern – I showed this chart in analysis in June and the expectation is that price is currently tracing out its way to a point 5 high. So, given the analysis above, the final high of the bull market would be the point 5 high on two separate 5 point broadening tops.
Fibonacci – (taken from June analysis) the question is how high will this bull trend trade? Given price is in blue sky territory I can only guess by taking an estimate of the subsequent bear market low using a Fibonacci Fan from the 1932 low to point 1 high set in 2000. I am looking for the bear market low to get back down to around the 76.4% angle which looks to be around the 4000 level. The 88.6% angle is around 2000 and that just seems too preposterous (as if the 4000 level doesn’t appear too!). After this bull market top is in, which I believe is still several years away, I think we will see a bear market similar to that which occurred after the 1929 top. In that case, price dropped around 90% into the 1932 low. If we are to see another 90% drop and assume the low will be around the 4000 level then that implies the final bull market high would be around the 38000 level.
Summing up – I believe a top is imminent with a substantial decline to follow, after which the overall massive bull market will resume.
By Austin Galt
Austin Galt has previously worked as a stockbroker and investment banker while studying technical analysis for over two decades. He is also the author of the book White Night: A Colombian Odyssey
Email - info@thevoodooanalyst.com
© 2018 Copyright The Voodoo Analyst - All Rights Reserved
Disclaimer: The above is a matter of opinion provided for general information purposes only and is not intended as investment advice. Information and analysis above are derived from sources and utilising methods believed to be reliable, but we cannot accept responsibility for any losses you may incur as a result of this analysis. Individuals should consult with their personal financial advisors.
Austin Galt Archive |
© 2005-2022 http://www.MarketOracle.co.uk - The Market Oracle is a FREE Daily Financial Markets Analysis & Forecasting online publication.