Gold and Silver Bottoming Pattern May Be in Process
Commodities / Gold and Silver 2018 Oct 04, 2018 - 06:02 PM GMTBy: The_Gold_Report
 Technical expert Jack Chan updates the gold and silver charts, including what he believes to be a bottoming pattern.
Our proprietary cycle indicator is now up.
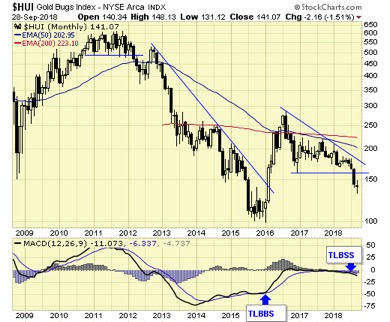
The gold sector is on a long-term sell signal. Long-term signals can last for months and years and are more suitable for investors.
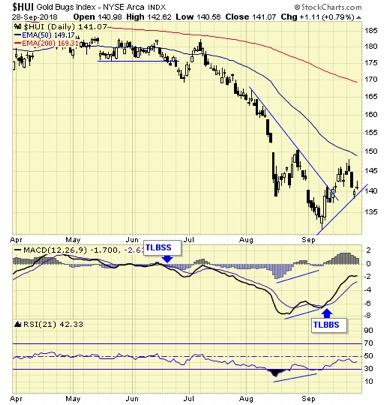
The gold sector is on a short-term buy signal. Short-term signals can last for days and weeks, and are more suitable for traders.
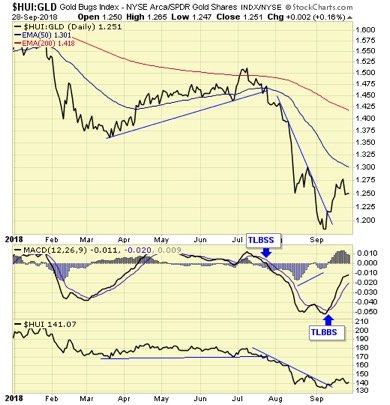
Our ratio between gold and gold stocks is on short-term buy signal. This ratio has been a leading indicator for the gold sector during the last gold bull market.
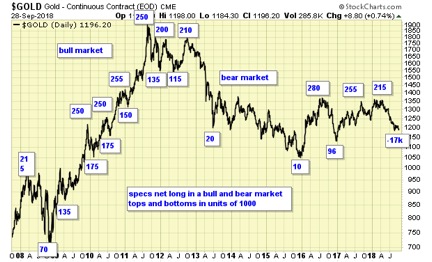
Speculation remains at a multidecade low.
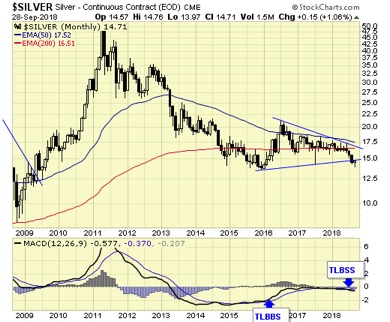
Silver is on a long-term sell signal.
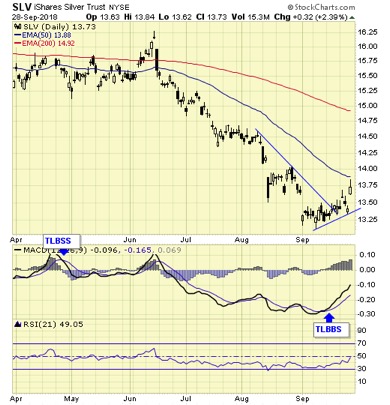
SLV is on a short-term buy signal, and short-term signals can last for days to weeks, more suitable for traders.
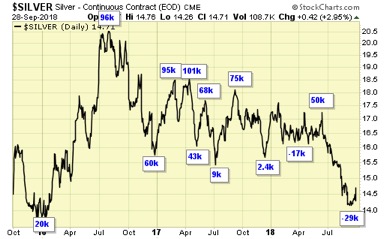
Speculation remains at a multidecade low.
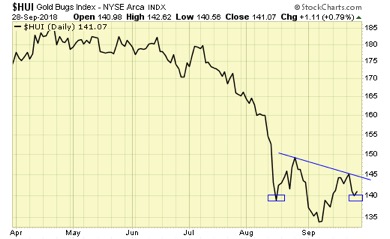
A potential bottoming pattern is in progress.
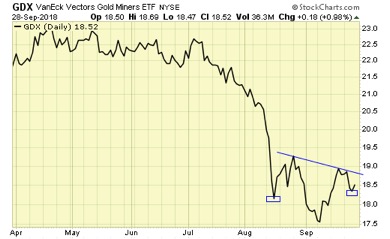
Summary The precious metals sector is on a long-term sell signal, which is suitable for trading and not for long-term holding. Short term is on buy signals. The cycle is up. A potential bottoming pattern is in progress.
Jack Chan is the editor of simply profits at www.simplyprofits.org, established in 2006. Chan bought his first mining stock, Hoko Exploration, in 1979, and has been active in the markets for the past 37 years. Technical analysis has helped him filter out the noise and focus on the when, and leave the why to the fundamental analysts. His proprietary trading models have enabled him to identify the NASDAQ top in 2000, the new gold bull market in 2001, the stock market top in 2007, and the U.S. dollar bottom in 2011.
Disclosure: 1) Statements and opinions expressed are the opinions of Jack Chan and not of Streetwise Reports or its officers. Jack Chan is wholly responsible for the validity of the statements. Streetwise Reports was not involved in any aspect of the article preparation or editing so the author could speak independently about the sector. The author was not paid by Streetwise Reports LLC for this article. Streetwise Reports was not paid by the author to publish or syndicate this article. 2) Jack Chan: We do not offer predictions or forecasts for the markets. What you see here is our simple trading model, which provides us the signals and set-ups to be either long, short, or in cash at any given time. Entry points and stops are provided in real time to subscribers, therefore, this update may not reflect our current positions in the markets. Trade at your own discretion. We also provide coverage to the major indexes and oil sector. 3) This article does not constitute investment advice. Each reader is encouraged to consult with his or her individual financial professional and any action a reader takes as a result of information presented here is his or her own responsibility. By opening this page, each reader accepts and agrees to Streetwise Reports' terms of use and full legal disclaimer. This article is not a solicitation for investment. Streetwise Reports does not render general or specific investment advice and the information on Streetwise Reports should not be considered a recommendation to buy or sell any security. Streetwise Reports does not endorse or recommend the business, products, services or securities of any company mentioned on Streetwise Reports.
Charts courtesy of Jack Chan
© 2005-2022 http://www.MarketOracle.co.uk - The Market Oracle is a FREE Daily Financial Markets Analysis & Forecasting online publication.


