


Stock Market Breaking Down After Long Uptrend. More short-term Weakness Ahead?
Stock-Markets / Stock Markets 2018 Oct 07, 2018 - 04:19 PM GMTBy: Troy_Bombardia

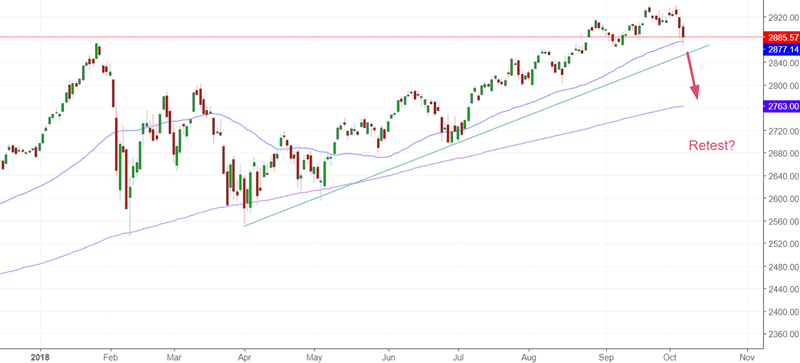
 Perspective is important. After a very steady rally over the past 3 months, the U.S. stock market is finally starting to “break down”. But before you panic, realize that this “break down” is very small in the grand scheme of themes. Some traders are looking for a retest of the 200 day moving average.
Several market studies support this short term bearish case.
*Please be careful: the short term is mostly random and is rarely better than a 50-50 bet.
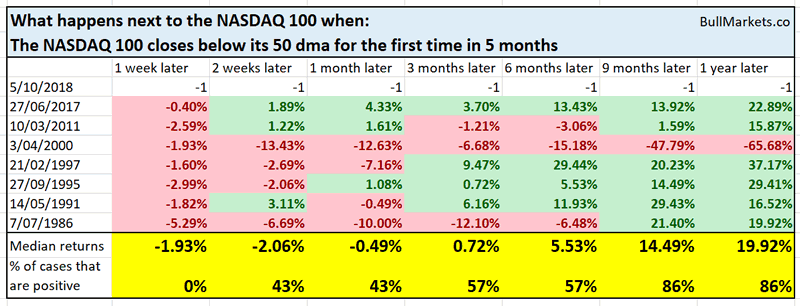
For starters, the NASDAQ 100 has broken below its 50 day moving average for the first time in 5 months.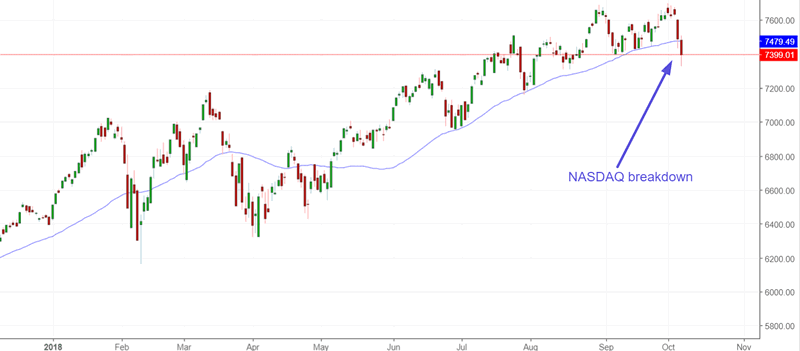
Historically, this led to more short term weakness for stocks over the next week.
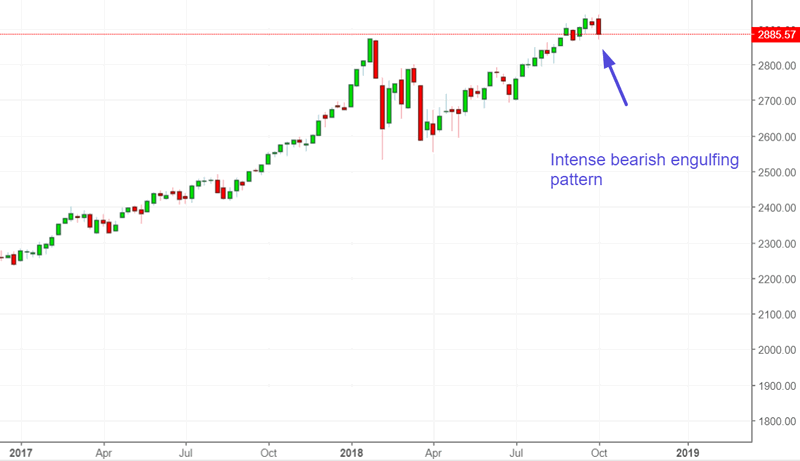
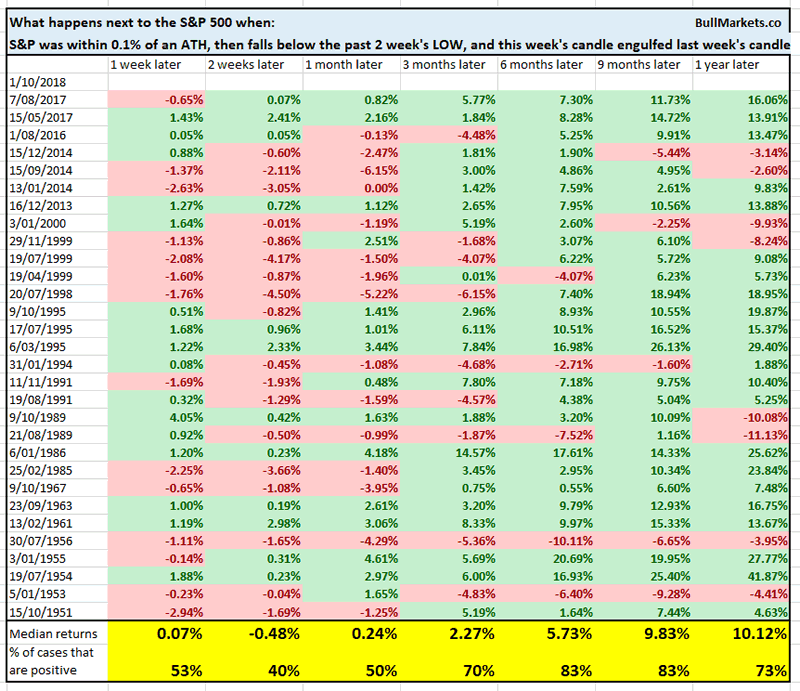
This week’s reversal in the S&P 500 was intense.
- The S&P was within 0.1% of all-time highs,
- Then it closed the week below the lowest LOW of the previous 2 weeks, and
- Completely engulfed the previous weak (bearish engulfing pattern: this week’s high is > last week’s high while this week’s low is < last week’s low)
Historically, this led to:
- Short term weakness (2 weeks later S&P up only 40% of the time).
- Long term strength (see 6-9 months forward returns).
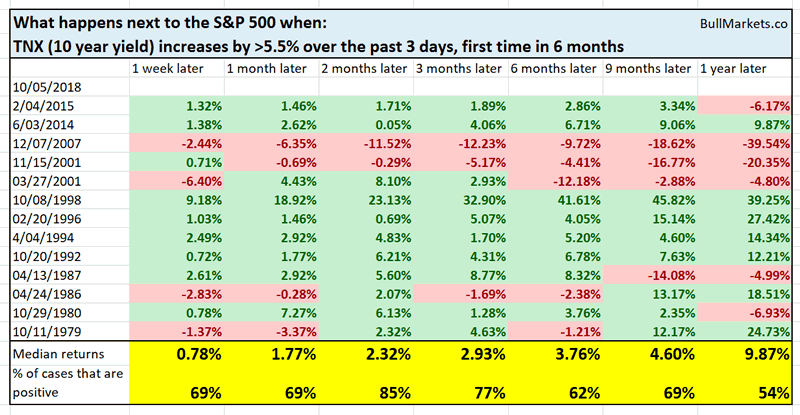
Should you panic about rising interest rates?
Yesterday’s market study answered that question with a resounding NO. Today’s study reveals the same thing.
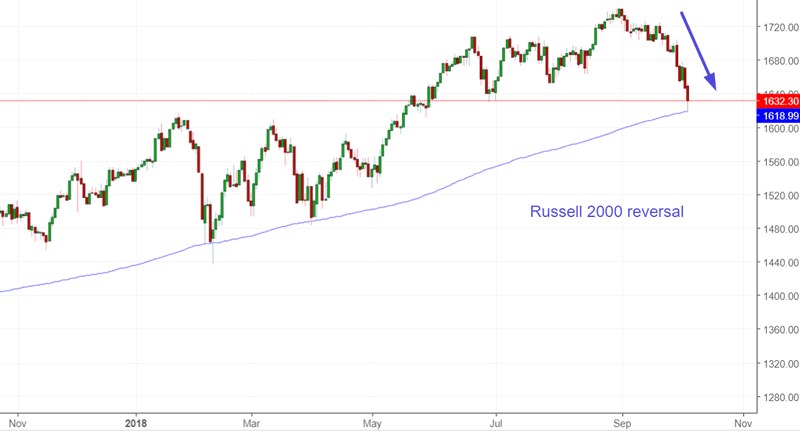
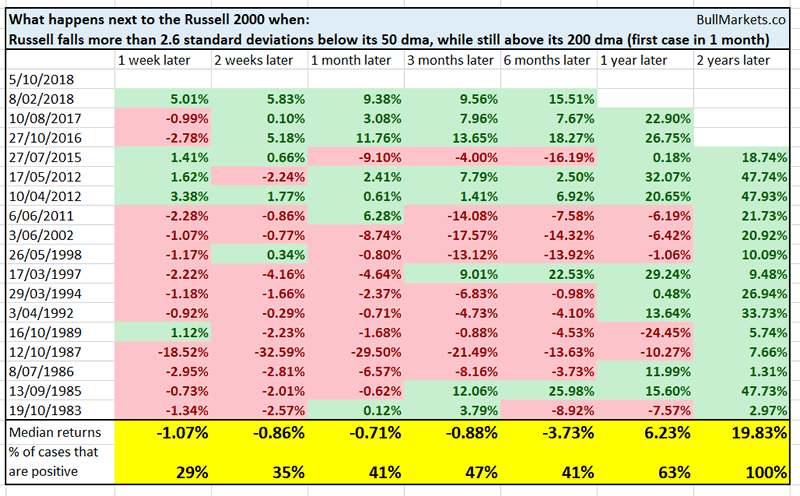
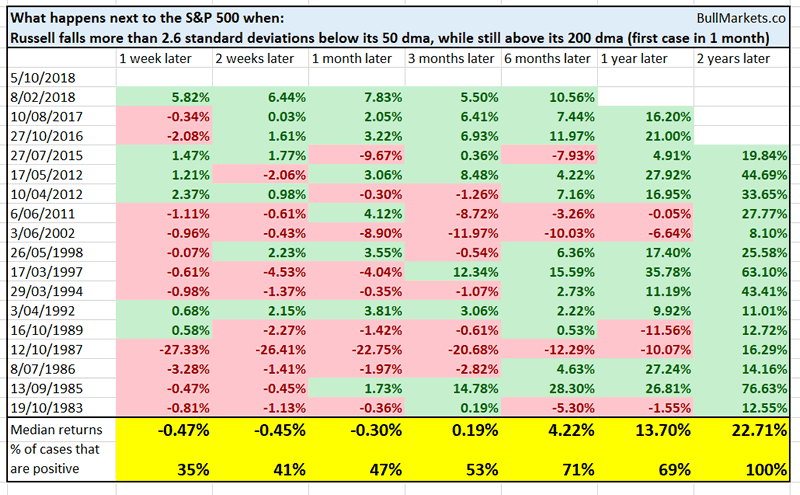
And lastly, the Russell 2000 (small caps index) has reversed downwards in a very intense fashion. It is now 2.6 standard deviations below its 50 day moving average, while still in an uptrend (i.e. above its 200 day moving average).
Historically, this led to short term weakness for both the Russell 2000 and the S&P 500 over the past 1-2 weeks. However, the long term was clearly bullish (see 1-2 years forward returns).
Conclusion
After a multi-month strong and steady uptrend, the U.S. stock market is breaking down a little. Historically, this led to some more short term weakness. However, the long term was bullish.
Why?
Because the first breakdown after a strong and steady uptrend isn’t usually the start of a major market top. Market market tops are preceded by rallies that are accompanied by much more volatility.
Click here for more market studies.
By Troy Bombardia
I’m Troy Bombardia, the author behind BullMarkets.co. I used to run a hedge fund, but closed it due to a major health scare. I am now enjoying life and simply investing/trading my own account. I focus on long term performance and ignore short term performance.
Copyright 2018 © Troy Bombardia - All Rights Reserved
Disclaimer: The above is a matter of opinion provided for general information purposes only and is not intended as investment advice. Information and analysis above are derived from sources and utilising methods believed to be reliable, but we cannot accept responsibility for any losses you may incur as a result of this analysis. Individuals should consult with their personal financial advisors.
© 2005-2022 http://www.MarketOracle.co.uk - The Market Oracle is a FREE Daily Financial Markets Analysis & Forecasting online publication.