Interest Rate Shock-Time to Find Out Who has been Swimming Naked
Stock-Markets / Financial Markets 2018 Oct 09, 2018 - 08:43 AM GMTBy: Plunger
 What Happened?
Could everything have changed in a 24 hour period? Apparently, Yes, Over the span of 24 hours markets woke up and realized that the FED may be at the cusp of committing Policy Error. Recently bonds have been teetering on the edge and this week Jerome Powell gave bonds a push off the ledge. Bonds delivered a message and the stock market was listening. Stocks got derailed along with bonds.
Yields blew out and sucked the air out of the stock market. So why the big move in bonds? Two reasons:
- Less demand for LT bonds due to the higher cost of hedging caused by higher yields, higher USD and emerging markets dropping.
- FED Chair Powell advertising he plans on being very aggressive with rates. He plans on raising rates until something breaks.
The market interpreted Powell’s remarks as Policy Error. Market players know that when something does break the FEDs policy response will likely be too slow, they will lose their grip and risk assets will crater. That’s what happened this week.
Just Another Step along the Post Bubble Contraction Highway
That’s what this is, it’s the initial shock from around the world finally reaching the world’s financial center. All year long we have seen foreign markets diverging away from the USA. Capital flows towards the center have made the US seem impervious to any problems outside the inner core:
In the course of 24 hours everything changed. Using Warren Buffets quip, it’s now time to find out who has been swimming naked! In our last PBC report I showed how Ray Dalio has publicly come on board to the PBC model. Since then the Stanley Drukenmiller interview hit the internet where he espoused these same concepts. Stan pointed out how the markets are filled with naked zombies floating around waiting to blow up once liquidity is withdrawn and rates begin to rise. This is all part and parcel of the PBC. So this week the markets visibly took the next step down the PBC highway.
This Week’s Big Story- Rate Shock
Before I show some charts let me say I remain firmly planted in the Lacy Hunt school of interest rates. This week I attended his presentation at the Stansberry seminar in Las Vegas where he updated his views on the course of interest rates in a PBC. Bottom line is one should expect rates on the long term 30 year US Government bond to continue to trend lower over the next 10-20 years. This of course is a non consensus view, but based on sound analysis and history. Therefore the pop in rates we are currently witnessing is temporary and eventually will reverse back downward. It is difficult to reduce a one hour explanation into a few bullet points, but I will try:
- The over use of credit (FED QE) is subject to the law of diminishing returns, therefore the productivity of debt ultimately decreases the velocity of money.
- Slowing money velocity leads to lower inflation over time. (this has been occurring for 20 years now)
- The long bond yield is a reflection of the inflation rate.
- When economic growth rates are below secular trend (it has been for 10 years now) you get lower inflation and lower bond yields
- Synchronized Global Monetary deceleration is now occurring everywhere in the world which will lead to decelerating economic growth.
The above is the well grounded case for lower long term Government bond yields over the next 10-20 years, even though these rates are presently rising. The historical record supports this view:
In 1873 after the debt crash in the USA the economy went into a depression and bond yields trended lower for 20 years.
In 1929 despite massive intervention by the government throughout the 1930’s and the devaluation of the USD against gold the US Government LT bond trended down for the next 18 years.
In post 1989 Japan despite never before seen massive central bank intervention and money printing, JGB’s trended down in yields for the next 25 years.
So long term 30 year Government rates should continue to trend down over the next 10-20 years in the USA, but for now we see rates rising. With both government and corporate bonds rising things are starting to blow up:
This weeks news: Mattress Firm files for Chapter 11 bankruptcy protection, will close up to 700 stores.
Consider this the first debt bloated zombie floating around naked. Mattress firm declared bankruptcy this week. Just 2 years ago they were a buy out darling rolling up multiple mattress companies all at a market premium. Here are the headlines from August 2016:
Mattress Firm Holding Co. (MFRM) Bought Out at 115% Premium
This is what the silver-gold ratio has been telegraphing all year a march towards credit stress:
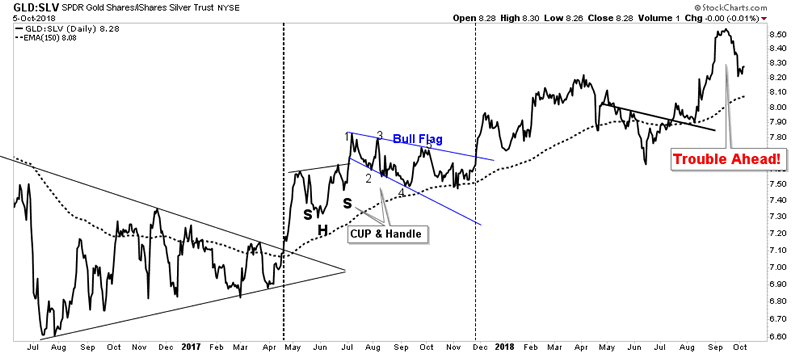
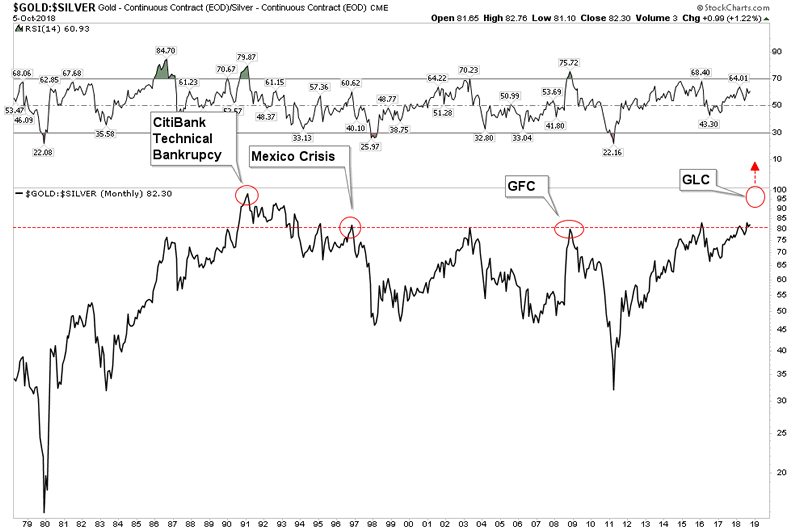
Previous Trigger Points:
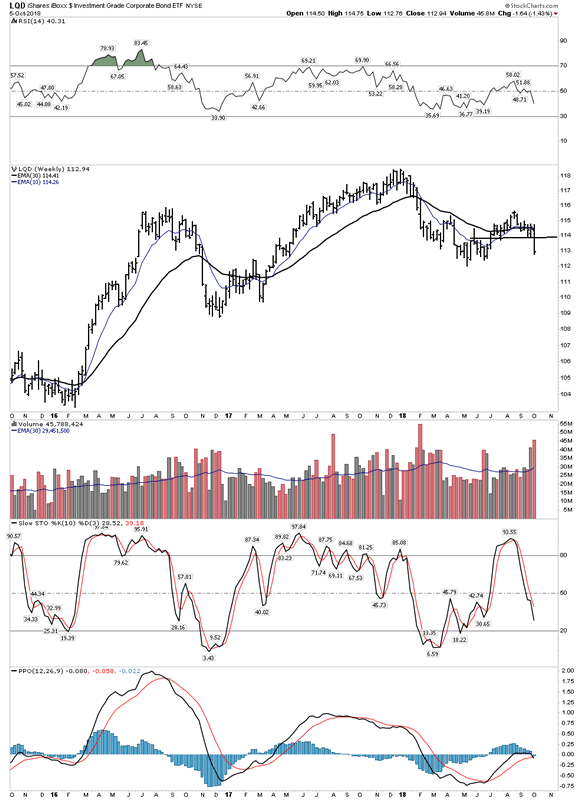
Investment Grade Corporate Bonds
The investment grade bonds are telegraphing a much less favorable market environment:
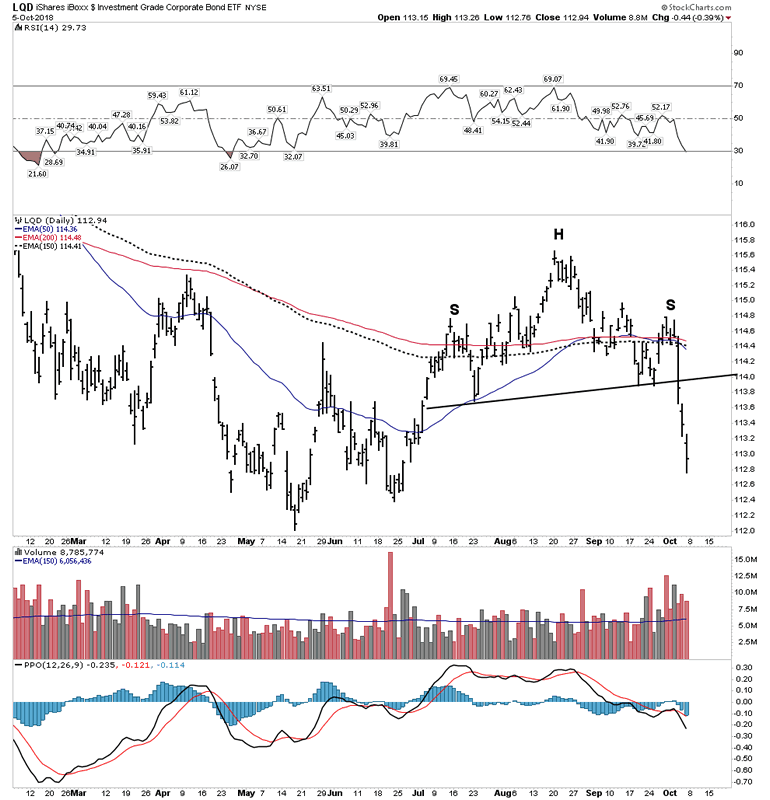
The Daily charts shows a clear break of a H&S neckline:
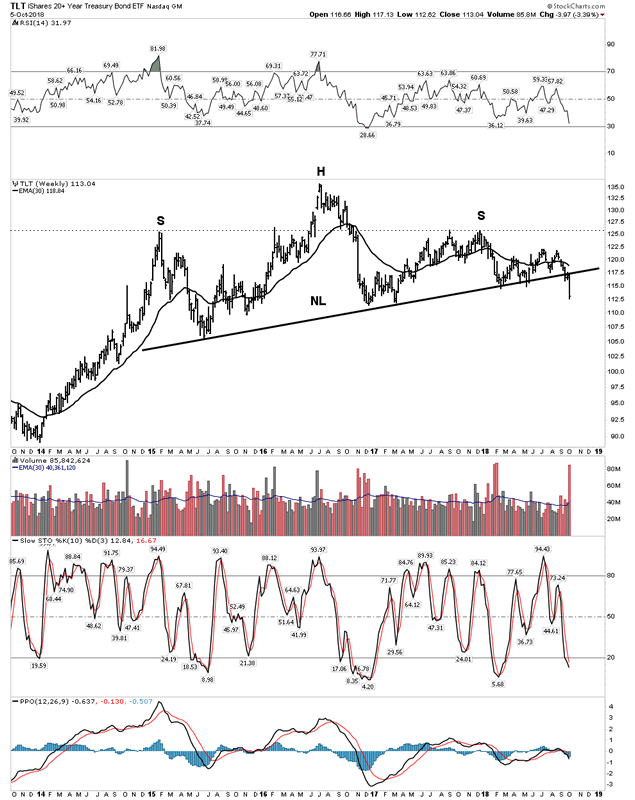
The TLT
The TLT is not the 30 year but they are longer duration government bonds and we can see how Chairman Powell pushed them off the cliff this week:
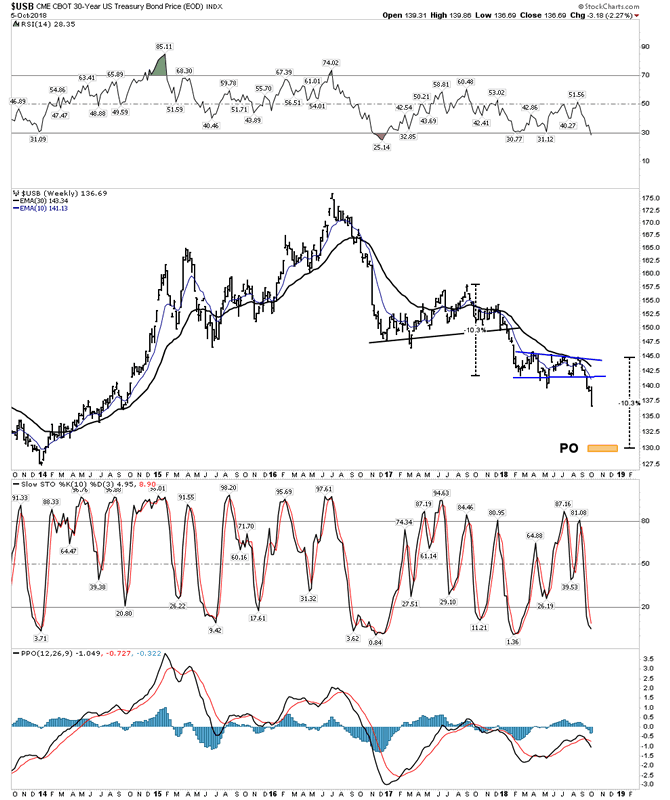
But let’s now look at the opportunity that will likely present itself further down the PBC highway. Long Term 30 Year Government Bonds. Yes, they cracked this week and look to be headed lower, however once the recession hits these bonds should rally and give us the opportunity for massive gains. The below chart gives us an objective for the 30 yr. Once prices reach this level one may consider looking for a base to form and going long the 30 year.
Economic lead indicators continue to point towards recession
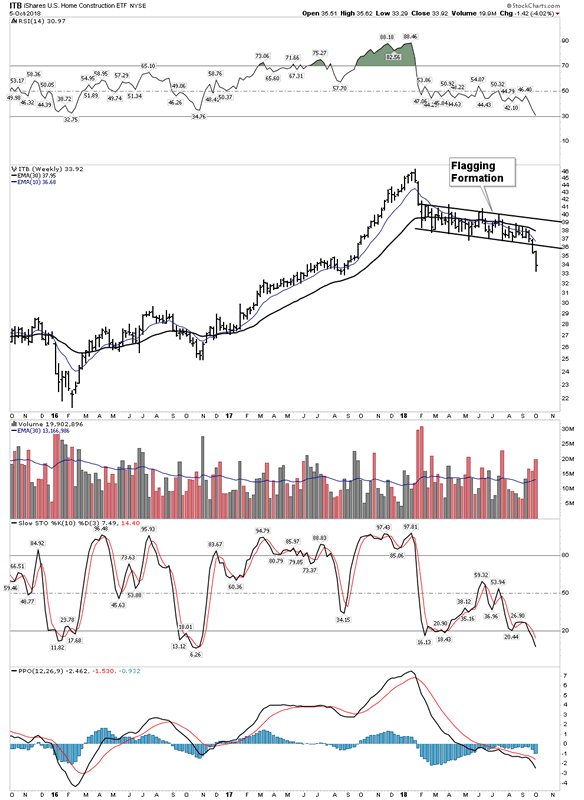
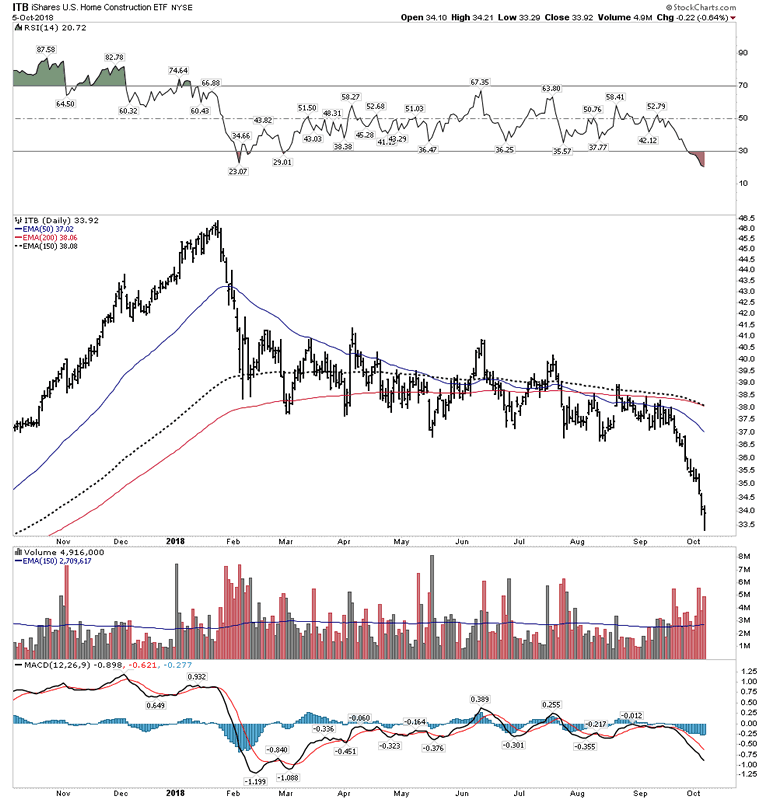
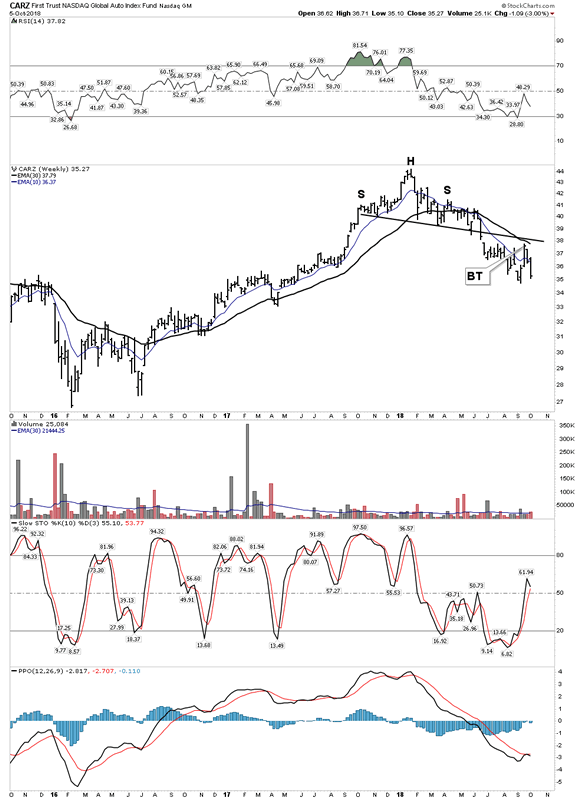
Last report we saw how housing and autos were showing gaping cracks opening up. These two sectors are classic-canary in the coal mine-indicators. Over the past 2 weeks they have broke wide open:
Housing– Full Break to the downside:
Daily- U-G-L-Y
Autos– Disastrous September Sales:
Ford down 25%
Toyota down 10%
Lexus down 25%
GM down 11%
DJ Autos:
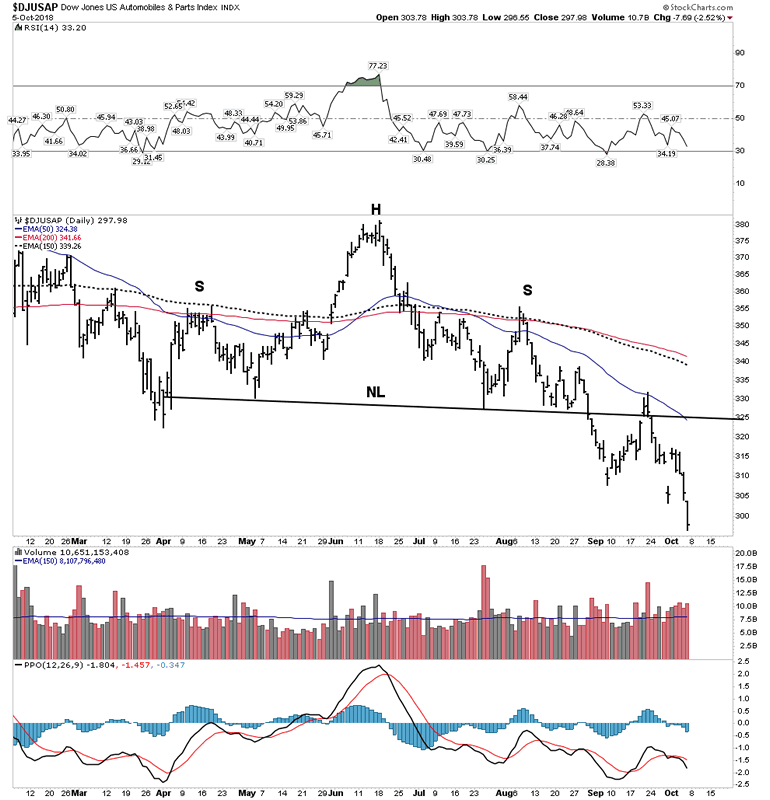
These sectors are now entrenched in bear markets and are engines of economic growth in good times. However, they are now reflecting underlying fundamental weakness in the US economy.
Is this the start of a bear market?
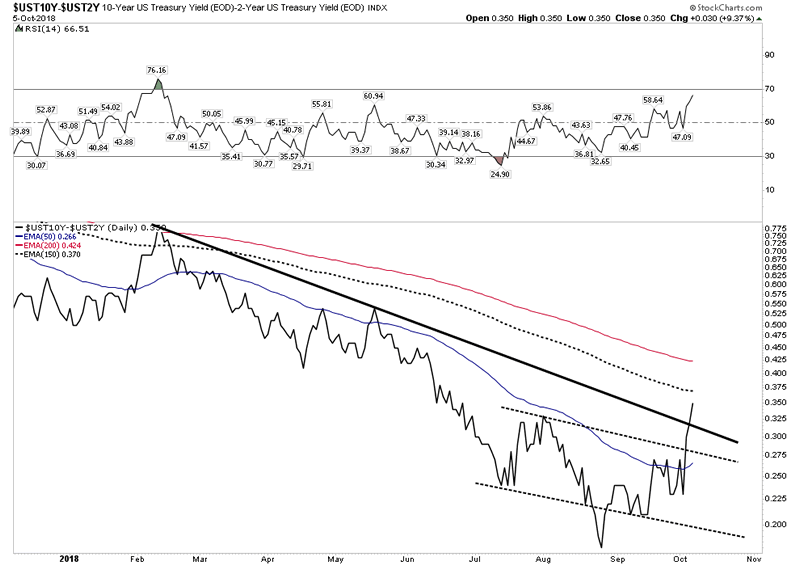
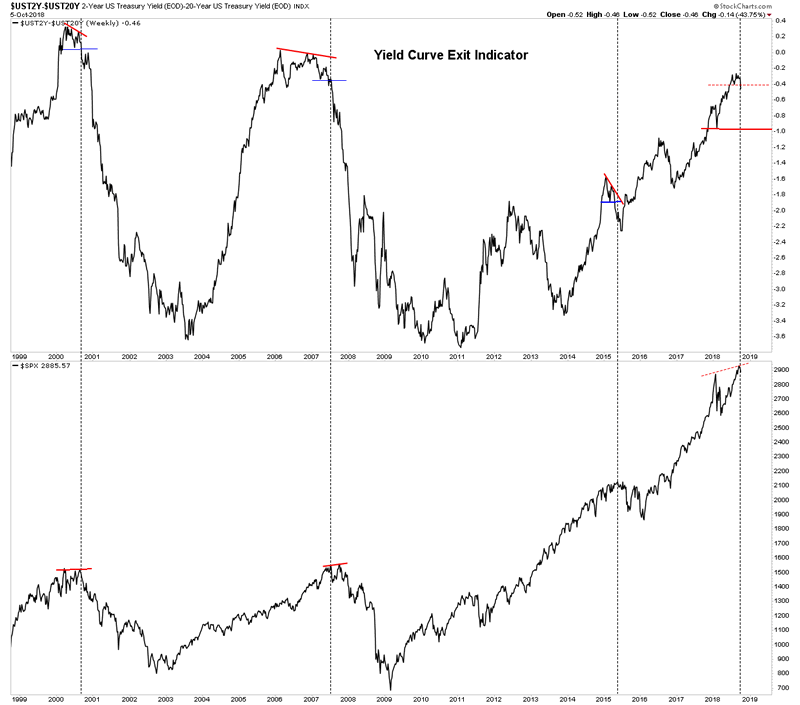
Too early to tell, however we are in a bear market watch zone. Signals are now popping up indicating we may be at a top. In the last report I introduced the 10 minus 2 interest rate topping indicator. It’s the indicator hedge fund managers are watching for their exit signal. When it establishes an uptrend expect a rush to the exits. Two weeks ago it appeared a ways off before any such signal. But look what happened this past week…it blew right on through any resistance. This is a flashing red light:
Yield Curve Exit Indicator (2s-20s)
Did the 2s-20s exit indicator just give us a signal as well? Again, it is very early on however when the 2s-20s violates the low of a topping consolidation it triggers a stock market exit. The topping pattern we see is not very extensive or developed, however we did just violate the previous low… Caution.
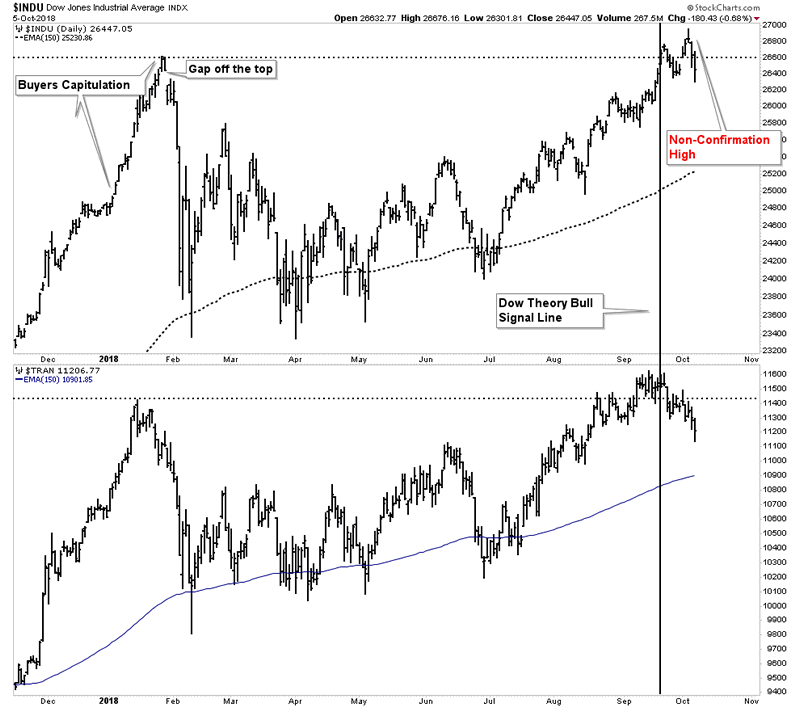
Dow Theory Non-Confirmation
Mr. Market is a trickster and I have suspected all year long that as all of the other indexes went on to new highs such as the SPX, NASDAQ, Russell etc the Dow would eventually eek out a marginal all time high just to ring the bell. That is in fact what happened, but immediately the Transports fell away and did not confirm the Dows most recent high, therefore we are now operating on a non-confirmation high. So as time progresses without a confirmed high the odds improve that the final high is in. Keep in mind Dow Theory serves as a barometer NOT a market timer.
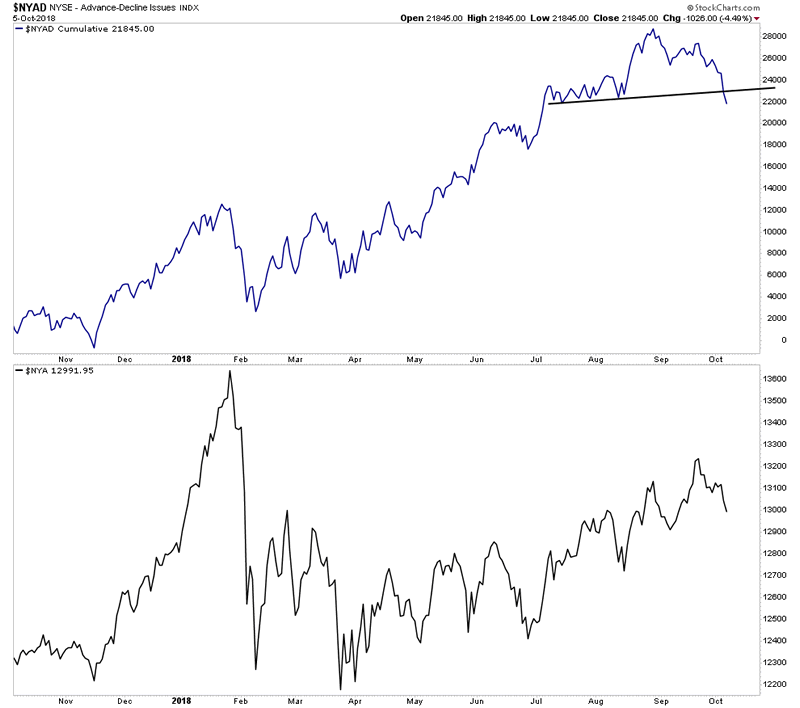
Advance- Decline Line-NYA
Still early on, but we can see advances over declines look like they are signaling weakness here:
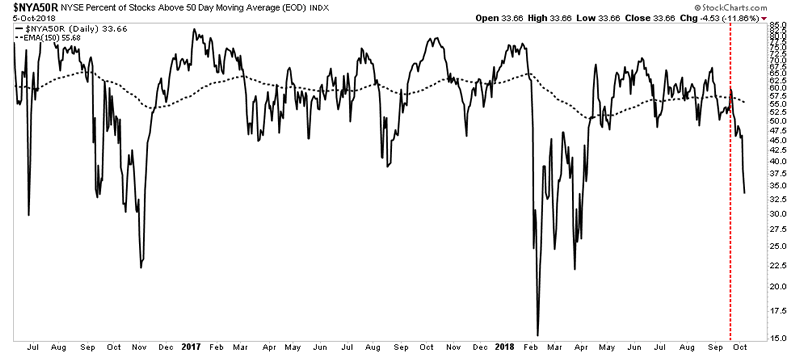
Percentage of stocks above their 50 EMA
Review this chart below of the percent of stocks above their 50 Day moving averages. I placed the red dashed line at the day of the markets all time high. Think about it, on this ATH day only 60% of stocks could hold themselves above their 50 EMA-pathetic. That’s a sign of market narrowness of breath.
Conclusion– It is too early to know if the top of the great bull is behind us. But signals are flashing everywhere and shoes are dropping. Bear market signals are showing up where we would expect them to. Until now dip buyers have always returned and bought it thus propelling the market onto new highs. But we also know the retail investor continues to buy 1/3 of the way into a bear market . Corporations are currently engaged in record stock buy backs while simultaneously managements are unloading personal stock positions. That’s using the corporate treasury keep stocks levitated while they bail.
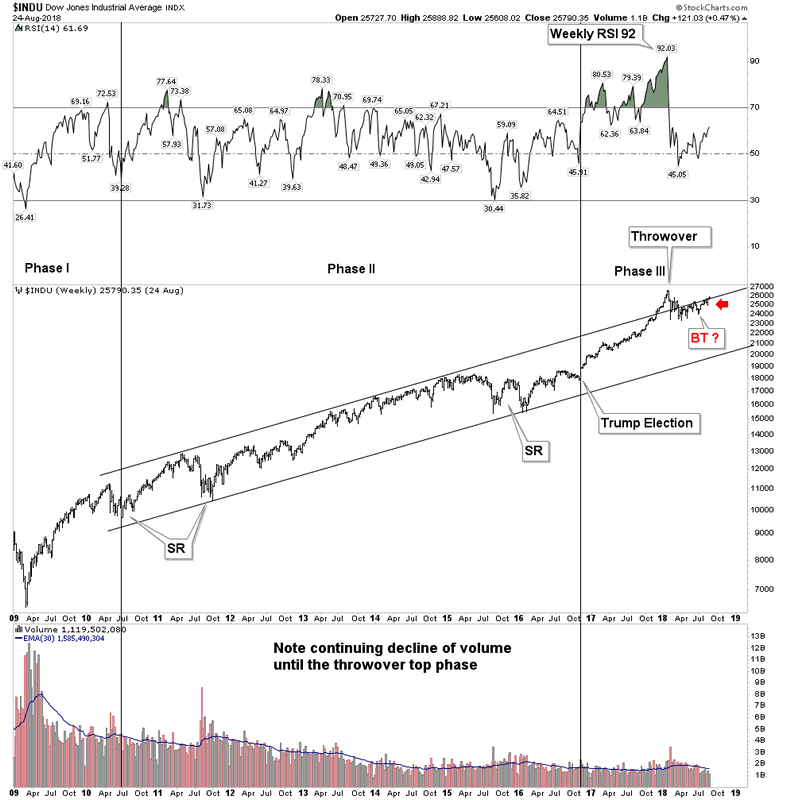
Finally let’s look at the entire record length bull run. Recall when the market peaked in January we stated that it was not likely to be a final top because it’s not normal for RSI to peak with the market. Instead we usually see the market hit new highs with failing RSI. Well we now have that. Also keep in mind the weekly RSI of 92 is the highest in the DOWs 120 year history which indicates an extreme mania. Although the top in January was not the top for the USA, it was the global synchronous top for the world.
Commodities– Setting up for a generational shorting opportunity.
In the last PBC report I presented the thesis of commodities imploding in the PBC. Since then they have rallied, so what’s up?
This is likely just an intermediate rally higher before demand is withdrawn. Trump’s tariffs are likely the force behind the surge in prices. End product users are scrambling to acquire commodities they know they will need before tariffs get put on. This is causing a surge in prices. It now appears to have completed its move higher as it has met its measured move price objective. Once it runs its course the roll over could be brutal.
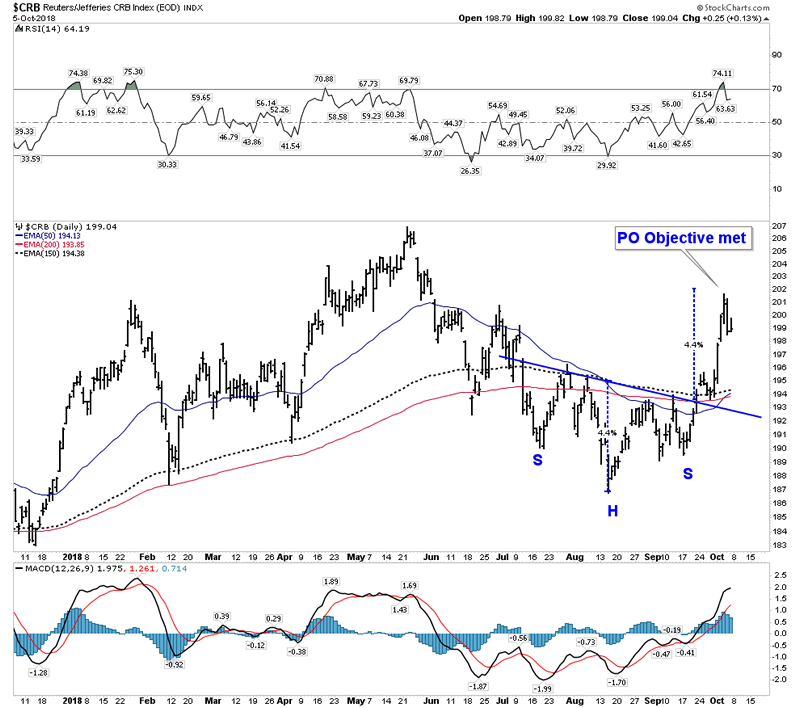
Revisiting Commodities Big Picture
You have all seen the big picture view of the CRB. Let’s now look at the same view, but in arithmetic scale. It makes the basement level price objectives look more achievable. We also now have a time window for this price objective… from 2020-2021
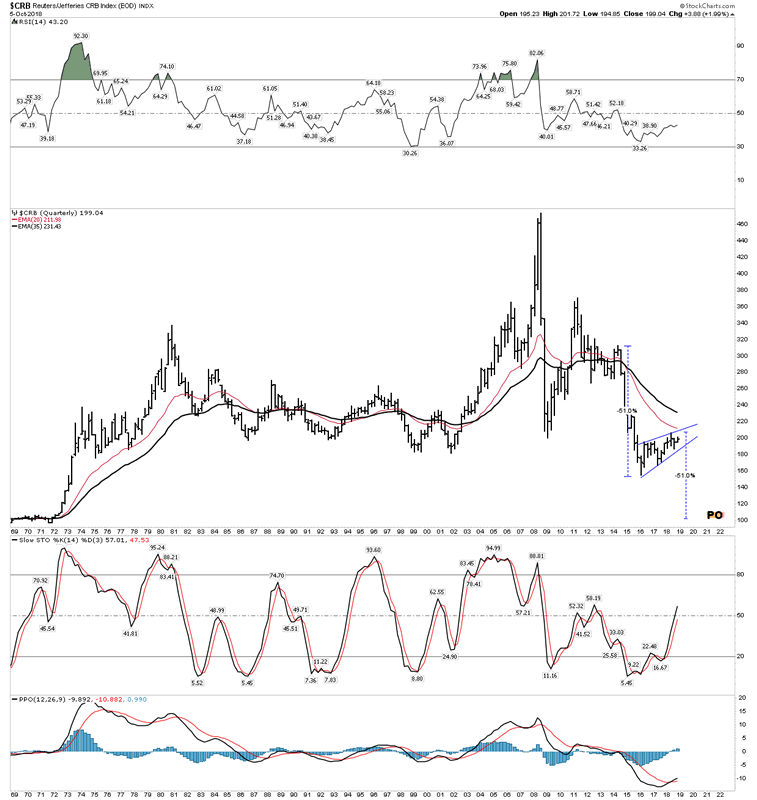
Trust me, there is no one out there making this call because they don’t have the chartology tools, as we do to make it. This is called an asymmetric trade, since no one out there can see it except for Rambus Knights.
Uranium- A Bull Market Unfolding Before our Eyes
At the beginning of this year in my market forecast edition I stated that uranium had the best risk-reward proposition of any investment in my lifetime. I stand by that claim and I believe we are seeing it now launch into a bull market.
There was no more hated or despised sector in the market space than uranium and it had undergone a 96% decline in its industry market cap. A true wipe out. But the facts are that 20% of all electrical production in the USA comes from nuclear (uranium fuel) and the USA only supplies 5% of its own fuel. Next door in Canada ALL of its legendary uranium production is already contracted for leaving no more for additional export. Uranium at $20/lb meant there would be no more new production of uranium to supply a future market. That’s the meaning of the Cameco mine shut down. Initially Cameco took one for the team and now they are playing catch up.
Uranium Price:
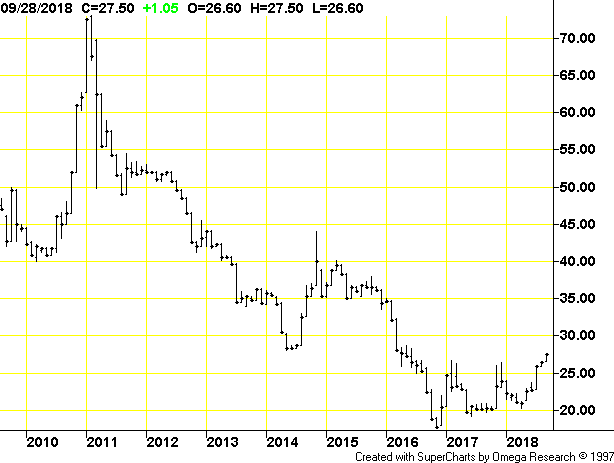
Above we see the nice base that uranium is now breaking out of. Note the series of higher lows over the past 2 years. You can see that a move to $40 looks easily achievable, yet would absolutely launch all uranium stocks if achieved.
Uranium ETF Price Proxy (U.to)
The below chart is the ETF that is a proxy for the uranium price. Here we see a very nice double bottom H&S base. It has now broken out above its NL and is engaged in a consolidation back test move. Its measured move puts it up to 6.20 which equates to a $35 uranium price. Coming from such depressed lows and well developed bases the stocks would absolutely blow the doors off if price were to reach its initial objective of $35.
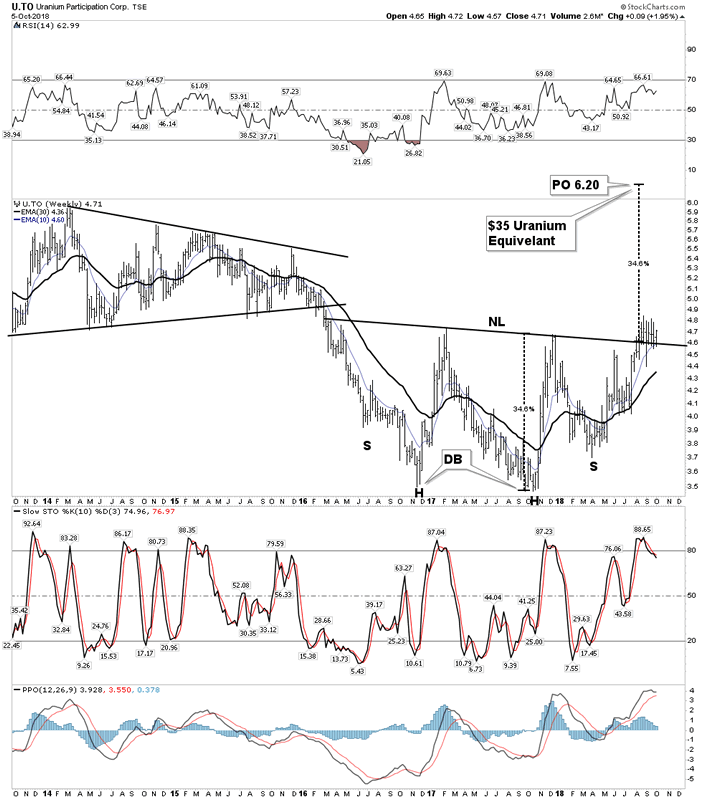
This is why I continue to buy into this sector. The stocks are stretched to the upside, but I think they are going higher and they just won’t pull back.
Question: Plunger I don’t get it, you are such a bear and you are plunging into the most volatile sector in the universe? Really?
Answer: Yes, Really. Hey it is what it is, just like it’s 5 o’clock somewhere there is always a bull market somewhere and that’s what this looks like. Looks like a duck…walks like a duck…quacks like a duck… it’s probably a bull market.
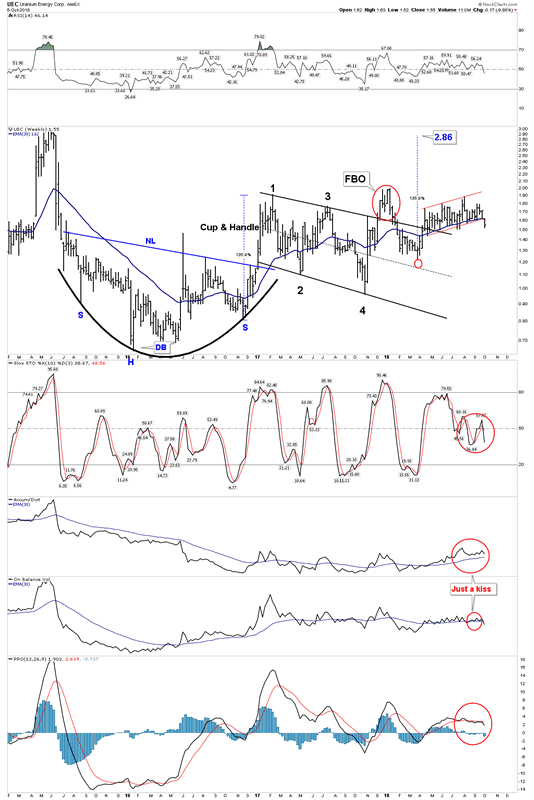
UEC– I have sold most of my UEC because I have come to mistrust management. Every time this stock starts to raise its head up management dilutes the share structure. They did it this week so I took the offering and immediately sold it just to strip off the warrant. Seems to me they are quite comfortable putting the shareholder last and it smells like a lifestyle company. They have lost my trust but it will probably still go up anyway.
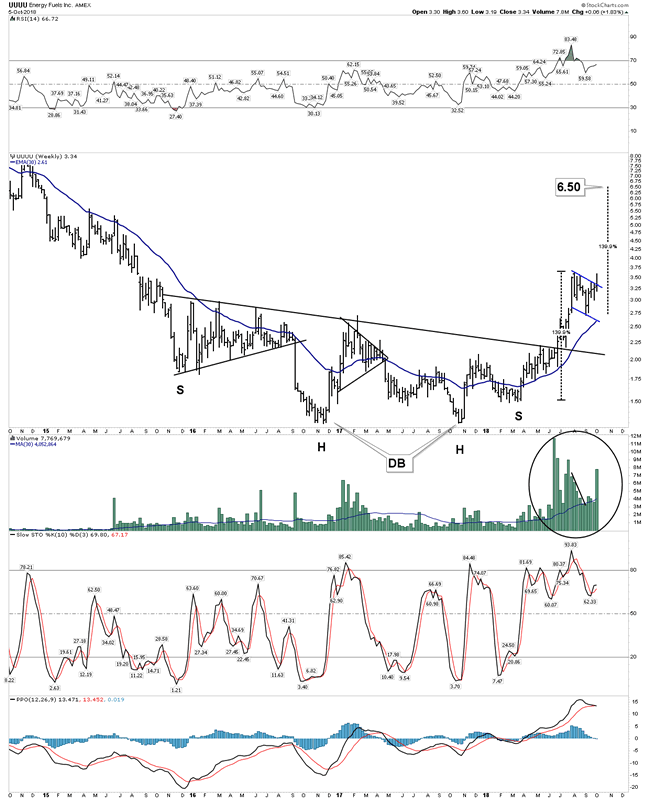
Energy Fuels
Plenty of doubters of this stock, but I am letting the chart speak for its potential. As a kicker they resume Vanadium production in November. Seems to me this pattern has $6.50 all over it.
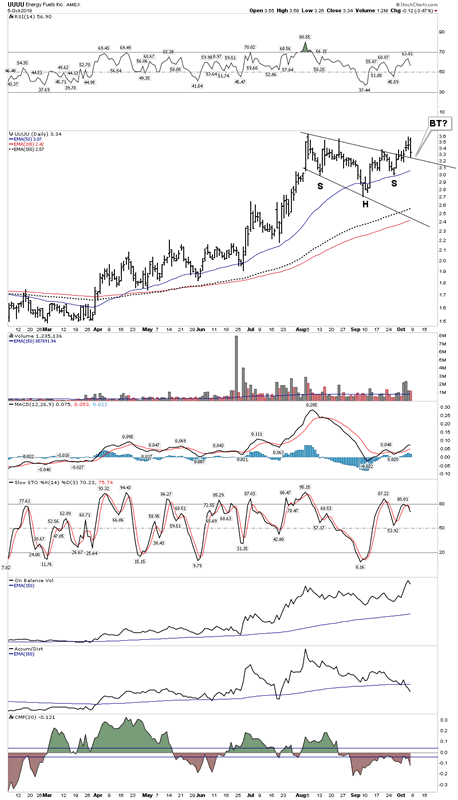
Maybe just a BT before a resumed move up.
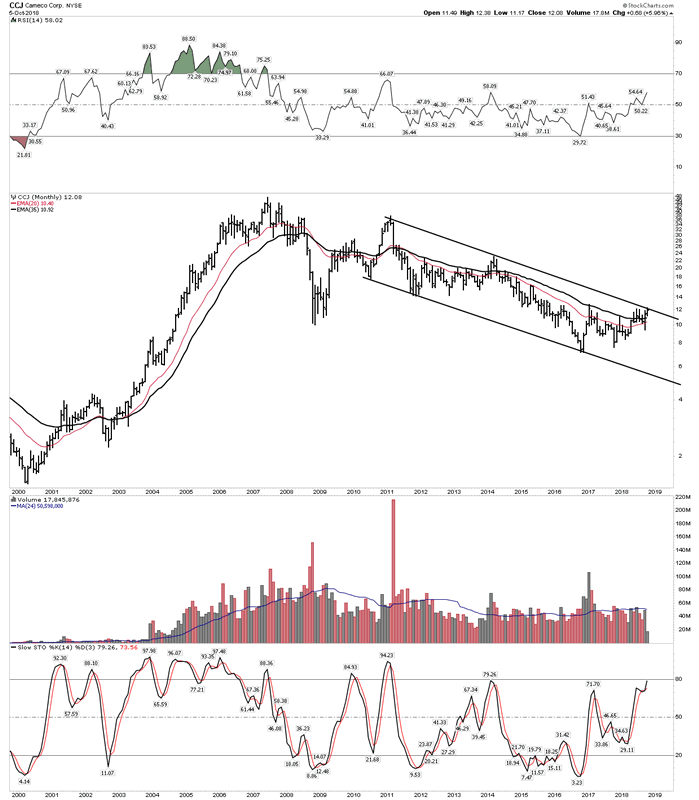
Cameco– At the cusp of greatness?
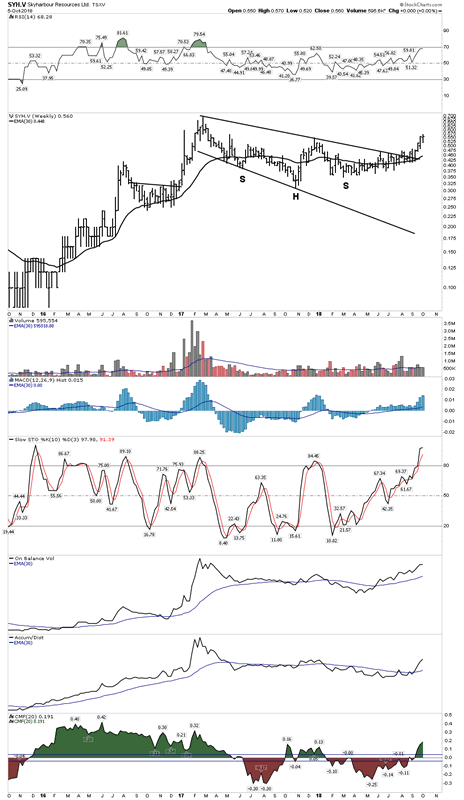
Skyharbour- Discovery awaits:
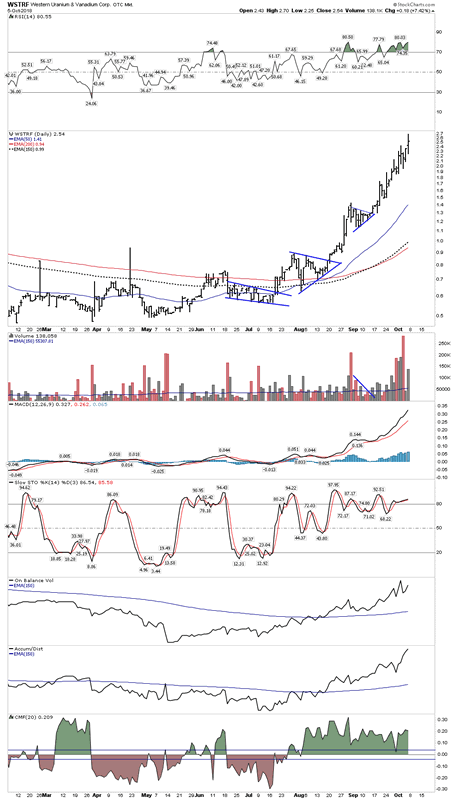
Western- Unstoppable…
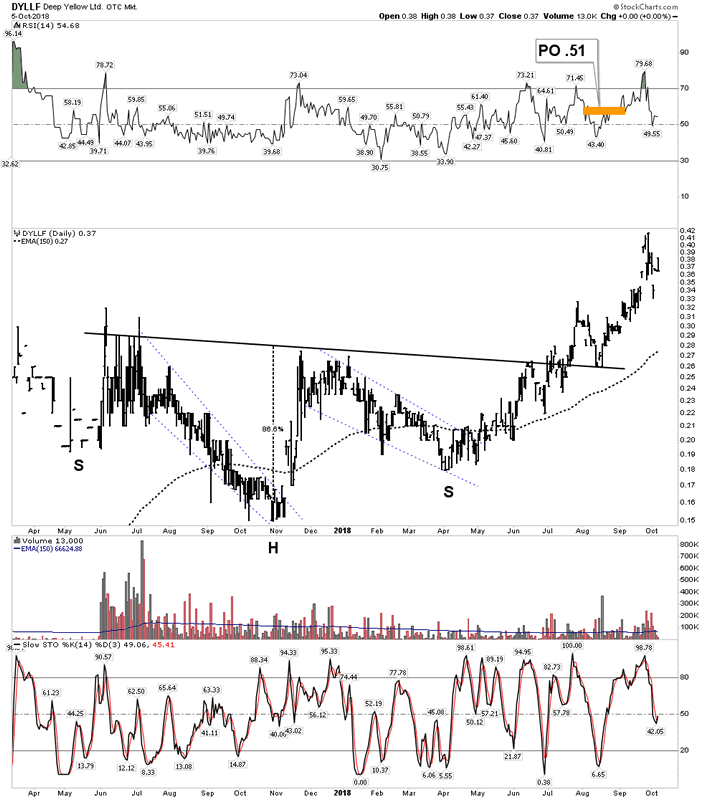
Deep Yellow- Unknown and thinly traded. Comes with experienced exploration team. Rick Rule has loaded the boat with Deep Yellow. So has Plunger.
In the future I will delve more into this sector but for now let’s move on…
Scandium International
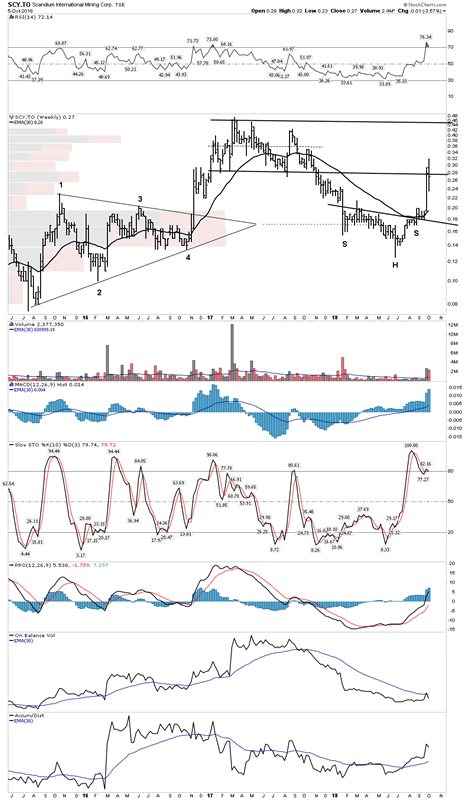
Yes, I have mentioned this before, but I would like to share with you what I see here. Maybe it’s because I have a degree in economics and engineering and have spent a lifetime in the transportation sector, but when I first heard the Scandium story it hit me with its full potential and possibilities. This company has first mover advantage and is in the process of creating an entire new industry. If they can do it, it will change everything and the world will beat a path to its door. It is why I made a big bet and took on an institutional sized position in this company and am willing to give it 5-8 years for them to develop their business plan.
The management of this company are quiet, but they are serious players with lot’s of industry experience. John Kaiser presents a very insightful podcast where he suggests that this company has the possibility of becoming a bubble stock someday. Who knows of course, but I see the possibility too.
http://www.howestreet.com/2018/10/02/three-potential-bubble-stocks/
Look at the chart and think from the perspective of chartology:
Does Kaiser see what I see, but with different glasses?
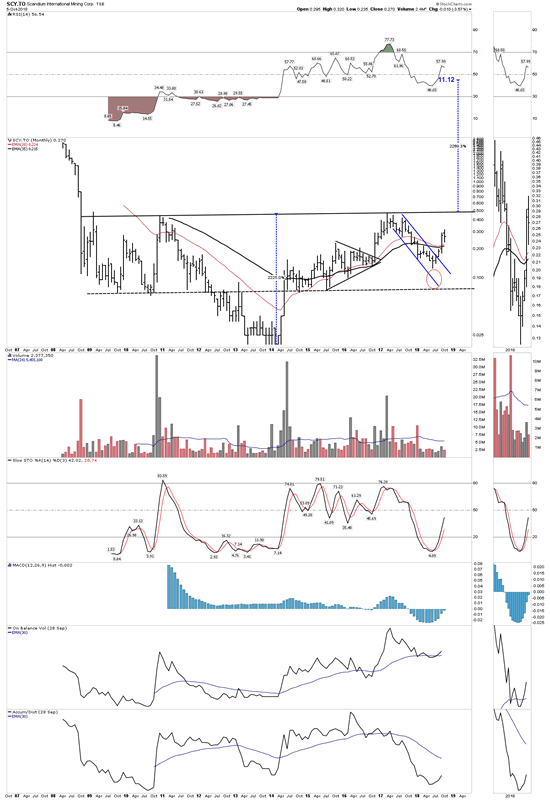
Weekly: The 70% drawdown appears over, expect news flow in the near future.
Gold in the Post Bubble Contraction
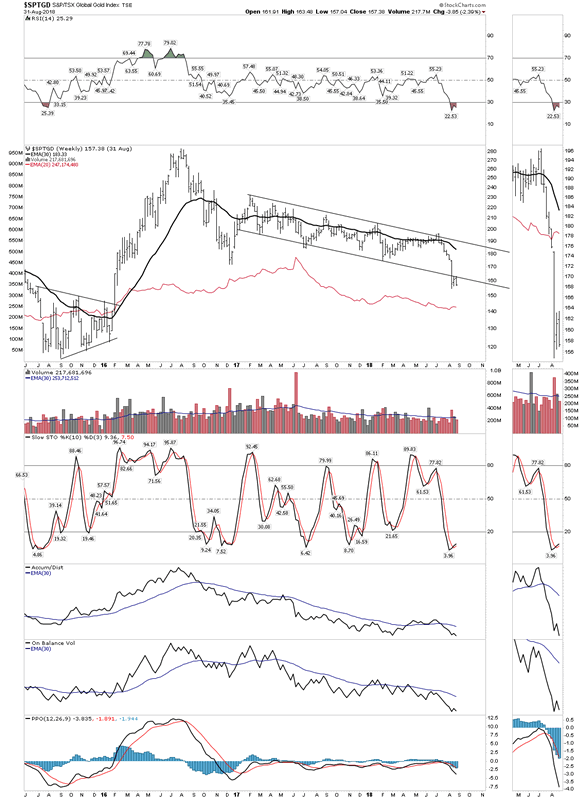
We have had some inquiry as to the path of gold during a post bubble contraction. In light of Rambus’ gold charts pointing toward lower lows from here many think it’s a dead asset. Not at all. I am on board with the price objectives that Rambus has depicted, but I also think they could be reached much quicker than many may think.
The Real Price of Gold–
The key is in understanding the significance of the real price vs the nominal price of gold. In an expanding economy with a bull market in stocks gold declines relative to financial assets… its real price declines. When the contraction comes however, gold goes up relative to financial assets… the real price rises.
In a PBC virtually everything goes down including commodities in nominal terms. Commodities such as oil account for close to 50% of extraction costs for a gold mine. Oil is used not only for hauling ore, but is also a chief component to explosives. Ultimately these lower costs flow through to the bottom line of a gold mining operation. Simultaneously the value of its end product, gold is increasing on a real basis. This explains why the gold miners typically have such robust bull markets during a PBC since they run counter to prevailing trends.
Homestake mining was America’s premiere mine during the PBC of the 1930’s. It was the Barrick of its day. During the inflationary year of 1928, its stock hit a low of $40. By 1937, in the depth of the depression, it had risen to $1080. That’s a 27 bagger in a period where the DOW had lost 89%. Those are the kind of gains that major companies can experience, not just the junior miners.
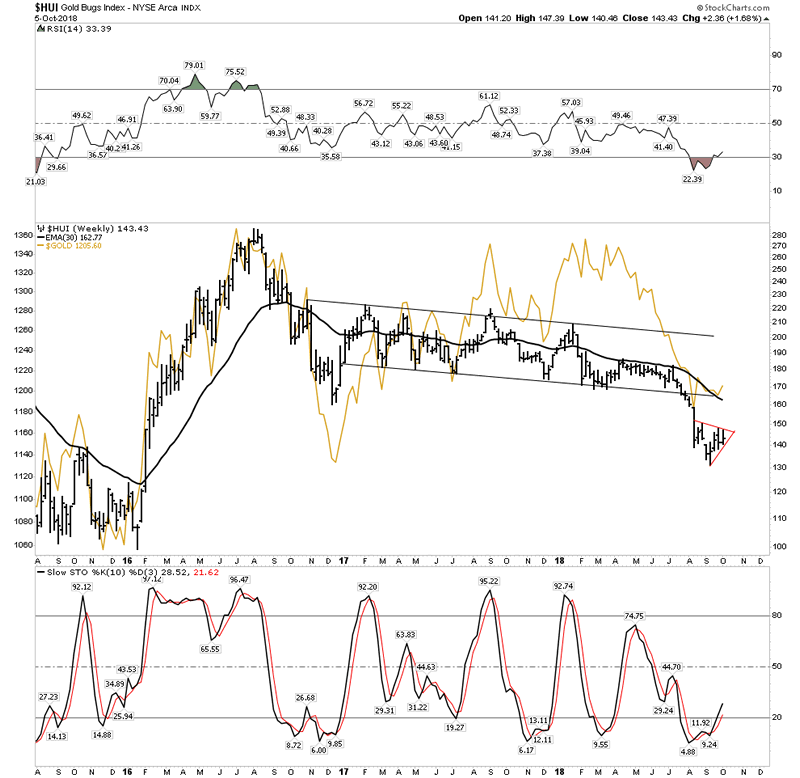
But according to Rambus’ charts the generational entry point that I speak of still lies in front of us. It is why I sit on a cash hoard. Rambus’ charts target an HUI in the vicinity of 100. That could come in a general market sell off and it may not last for long. Also since the sector has so much short interest, short sellers need to buy the stocks in order to close out their positions. So I plan on beating them to the punch and start taking initial positions before those levels because it may never get there.
The PM sector has been savaged, but look for the impulse wave down to continue on to lower price objectives:
HUI– A 100 level entry would be a lifetime opportunity.
We have so much more to cover in future reports as each week brings another major market event which validates our thesis. You should know that our strategy is in synch with the best investors in the world, Dalio and Druckenmiller, and we have a chartist (Rambus) who has no equal. It’s going to be an exciting ride.
Plunger
Plunger is Rambus Chartology’s Resident Market Historian and an associate writer. For a complete compilation of his work members can check the “Plunger” Tab .
Copyright © 2018 Plunger - All Rights Reserved
All ideas, opinions, and/or forecasts, expressed or implied herein, are for informational purposes only and should not be construed as a recommendation to invest, trade, and/or speculate in the markets. Any investments, trades, and/or speculations made in light of the ideas, opinions, and/or forecasts, expressed or implied herein, are committed at your own risk, financial or otherwise. The information on this site has been prepared without regard to any particular investor’s investment objectives, financial situation, and needs. Accordingly, investors should not act on any information on this site without obtaining specific advice from their financial advisor. Past performance is no guarantee of future results.
© 2005-2022 http://www.MarketOracle.co.uk - The Market Oracle is a FREE Daily Financial Markets Analysis & Forecasting online publication.


