Stock Market is Making a Sharp Rally After a Sharp Drop. What’s Next?
Stock-Markets / Stock Markets 2018 Oct 18, 2018 - 12:39 PM GMTBy: Troy_Bombardia
Today’s big bounce has some people comparing the current market environment to October 2014, when the stock market dropped quickly and surged back to new all-time highs quickly.
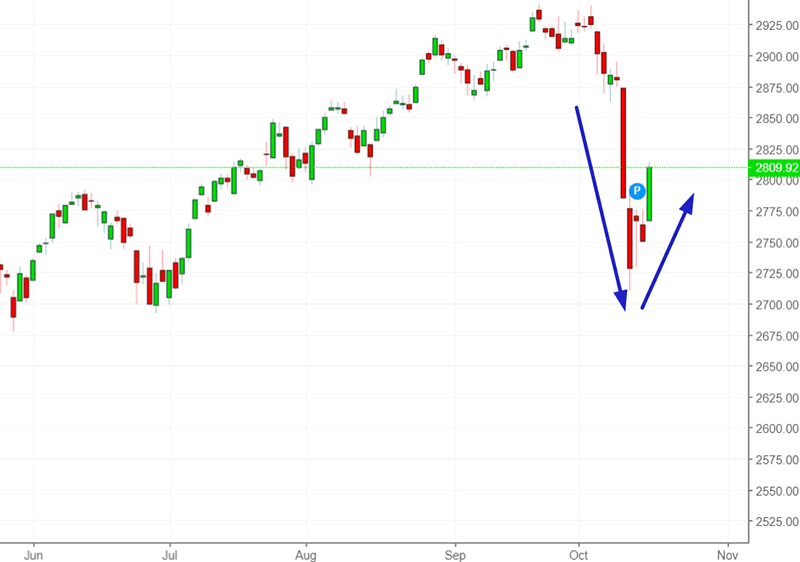
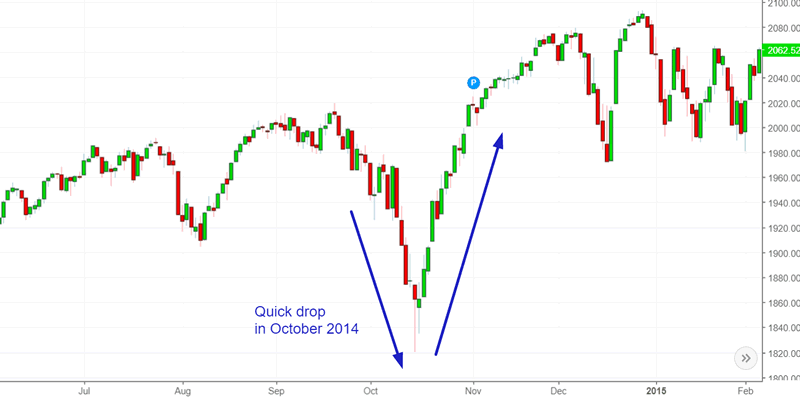
The key point to remember is that:
- The medium term risk:reward is bullish
- The stock market usually (but not always) retests its lows.
Focus on the medium-long term.
With that being said, let’s get into quantifying and examining the stock market’s recent price action.
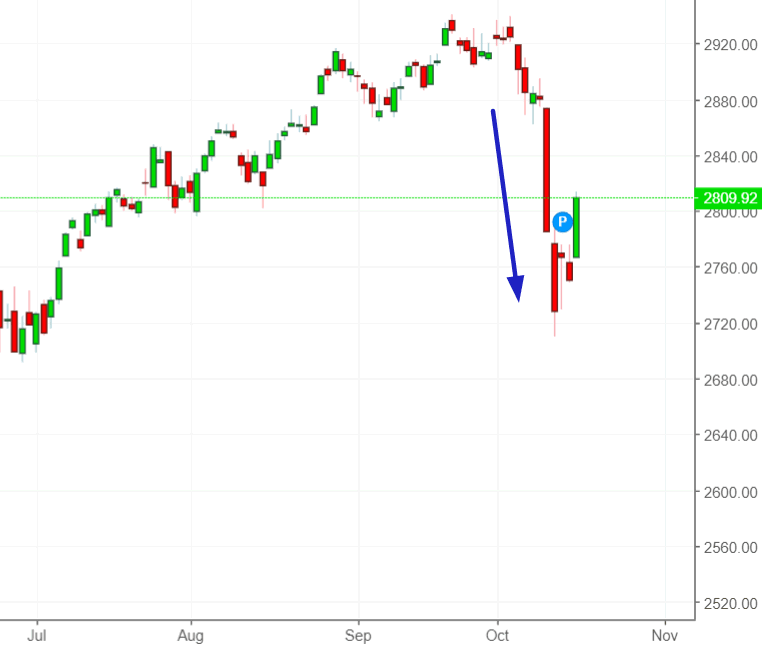
The stock market’s sharp reversal after a sharp drop
The stock market fell more than -2% for 2 consecutive days last week (Wednesday & Thursday), and then it rallied more than +2% today.
This is what happens next to the S&P 500 when it falls more than -2% for 2 consecutive days, then rises >2% in 1 day within the next 3 days.
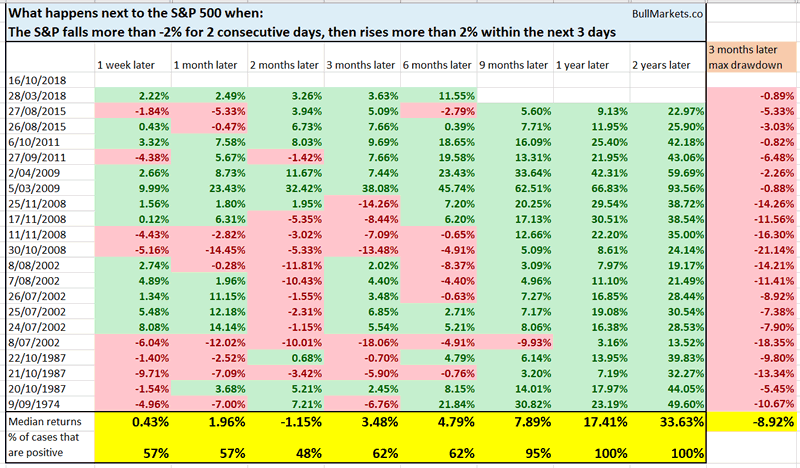
As you can see, this tends to happen at the bottom of bear markets or big 14%+ declines. The only other time it happened after a smaller decline was this March 2018 at the stock market’s bottom.
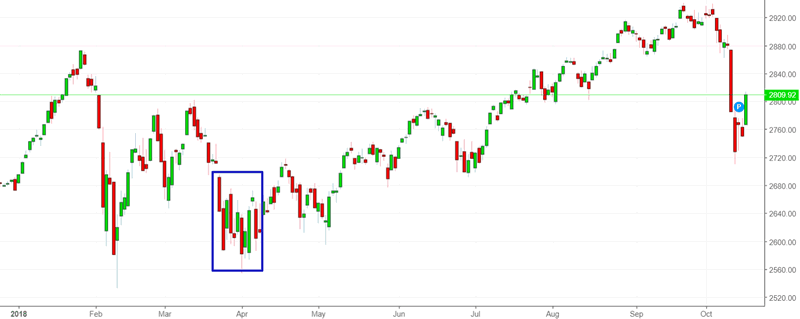
You can see that even in this case, the S&P retested its lows before heading higher.
Another way to examine the stock market’s sharp reversal
The stock market fell more than -6% in the past 1 month after making a new all-time high (using daily CLOSE $), and today rallied more than 2%.
Here’s what happens next to the S&P 500 (historically) when it falls more than 6% from an all-time high in the past month, and then rallies >2% in 1 day.
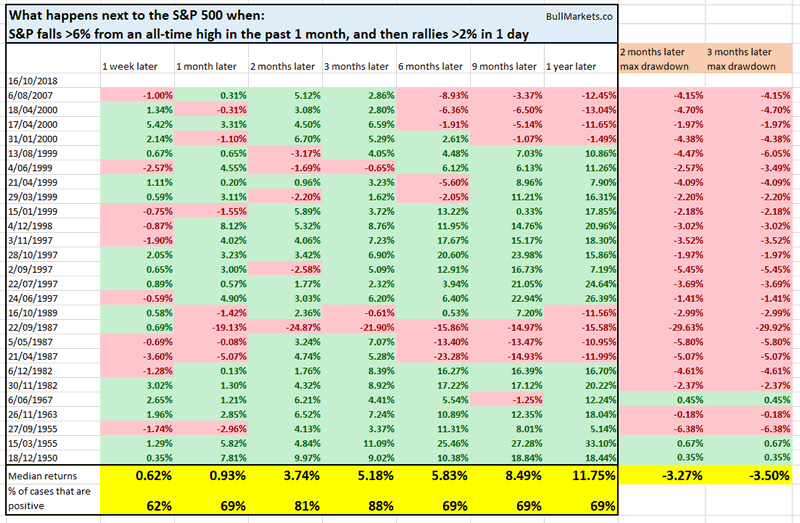
Note that the S&P’s median drawdowns in the next 2-3 months is more than -3%, which supports the case for a retest.
However, what’s more interesting is that when this happens, the S&P goes up 3 months later 88% of the time. Even in the worst case scenarios (2000 and 2007 tops), the stock market still bounced. Bear markets don’t go down in a straight line.
Oversold bounce
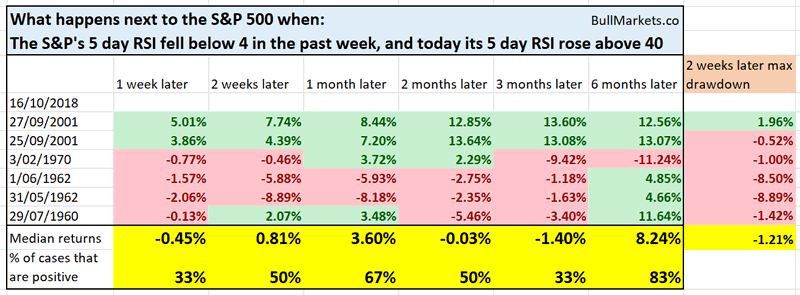
And lastly, the S&P’s short term momentum (RSI 5) has bounced back from being extremely oversold.
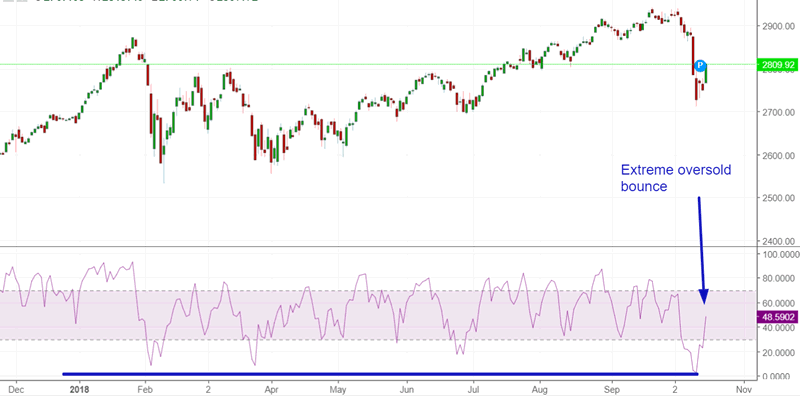
The S&P’s 5 day RSI went from being below 4 to above 40 in less than 1 week. Historically, it had a median drawdown over the next week of -1.2%
Click here for more market studies
By Troy Bombardia
I’m Troy Bombardia, the author behind BullMarkets.co. I used to run a hedge fund, but closed it due to a major health scare. I am now enjoying life and simply investing/trading my own account. I focus on long term performance and ignore short term performance.
Copyright 2018 © Troy Bombardia - All Rights Reserved
Disclaimer: The above is a matter of opinion provided for general information purposes only and is not intended as investment advice. Information and analysis above are derived from sources and utilising methods believed to be reliable, but we cannot accept responsibility for any losses you may incur as a result of this analysis. Individuals should consult with their personal financial advisors.
© 2005-2022 http://www.MarketOracle.co.uk - The Market Oracle is a FREE Daily Financial Markets Analysis & Forecasting online publication.


