


More Signs of a Stocks Bull Market Top and Start of a Bear Market in 2019
Stock-Markets / Stock Markets 2018 Oct 19, 2018 - 02:36 PM GMTBy: Troy_Bombardia

 More than 1 month ago I explained my main long term worry for the U.S. stock market:
The economy & the stock market move in the same direction in the medium-long term. Key economic indicators tend to deteriorate BEFORE bull markets end.
But here’s the tricky part. Sometimes leading economic indicators deteriorate JUST before bull markets end (i.e. only a few months before). Sometimes leading economic indicators deteriorate 2 years before bull markets end. This makes it hard to estimate the bull market’s exact top.
The best way to deal with this is:
- Accept that it’s IMPOSSIBLE to consistently and accurately catch the bull market’s exact top.
- Use position size to scale-out, thereby reducing risk incrementally as time goes on.
Key U.S. economic indicators have not deteriorated significantly so far. HOWEVER, I believe they will start to deteriorate in 2019, if not 2020 at the latest (2019 is far more likely than 2020).
Right now we are starting to see some deterioration in the U.S. economy, namely in the housing sector (I wrote about this on September 28 as well). The deterioration isn’t significant, but bulls should watch out if it continues.
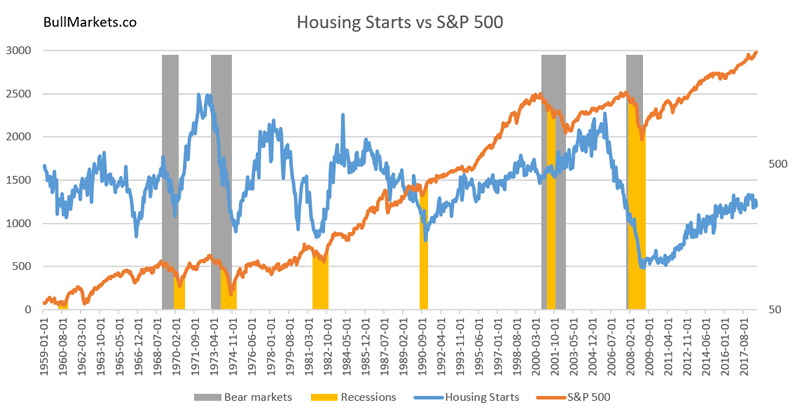
*Aside from the labor market, the housing sector is one of the best long term leading indicators for the U.S. stock market and U.S. economy.
The latest reading for Housing Starts fell from its previous reading (1268k to 1201k).
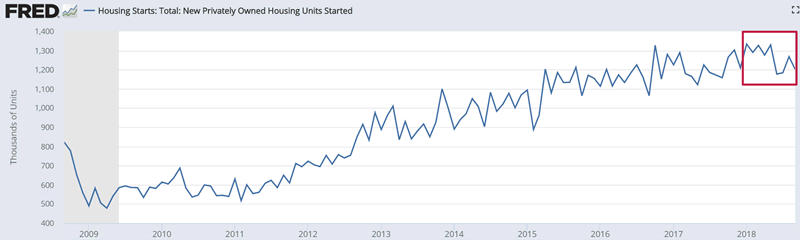
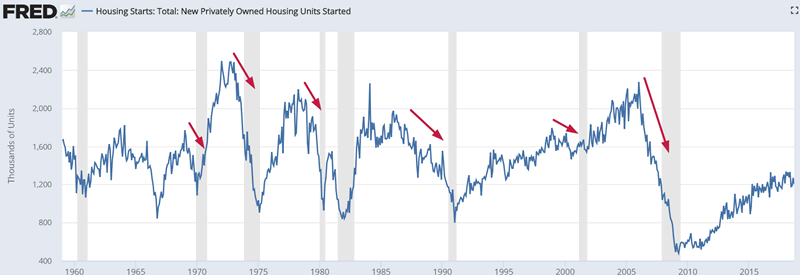
This leading indicator tends to trend downwards before economic recessions and bear markets begin.
Likewise, the latest reading for Building Permits fell from its previous reading (1249k to 1241k).
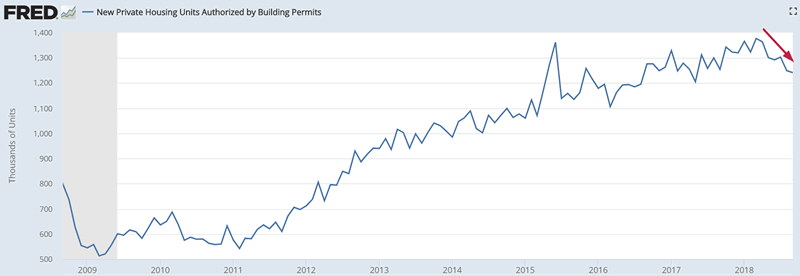
This leading indicator tends to trend downwards before economic recessions and bear markets begin.
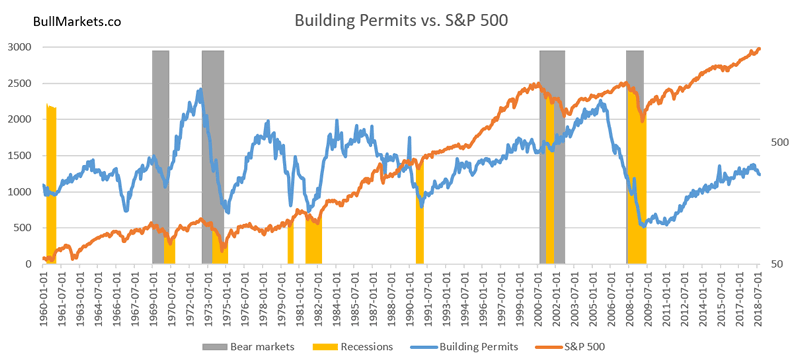
As you can see, the housing sector (Housing Starts, Building Permits, New Home Sales) is starting to deteriorate. The deterioration isn’t significant, but watch out if it persists for a few more months.
Here’s another way to look at the semi-clear weakness in the housing sector.
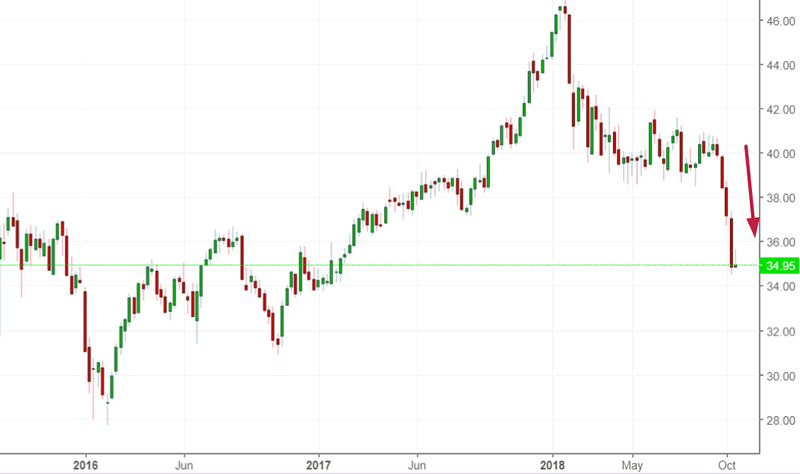
Here’s XHB, the U.S. homebuilders ETF. It has massively underperformed the broad U.S. stock market this year. The pace of its decline has increased this September.
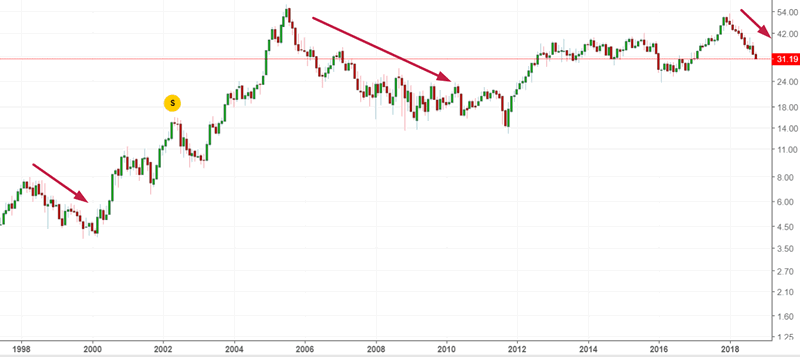
XHB’s historical data is limited from 2006 – present. We can use Toll Brothers as a proxy for XHB and homebuilders. (Toll Brothers is one of the largest homebuilders in the U.S.).
As you can see, Toll Brothers has fallen significantly in 2018 (down by approximately -40%) while the overall U.S. stock market has increased.
The following chart is a log scale of Toll Brothers.
Here are the historical cases in which the S&P goes up more than 10% in the past year, while Toll Brothers goes down more than -25% in the past year (first case in 1 year to avoid overlaps).
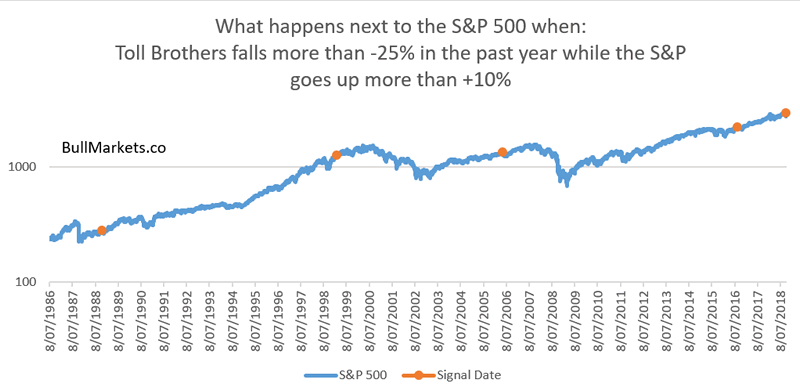
Here are the signal dates:
- October 9, 2018
- August 19, 2016
- May 10, 2006
- February 5, 1999
- October 19, 1988
*There was a false SELL signal in 2016, but that was mostly due to Toll Brothers’ own internal problems. The broad housing sector was improving at the time.As you can see, this tends to happen 1 year before a bear market (e.g. 2000 and 2007) or recession-driven “big correction” in the U.S. stock market (e.g. 1990).
With that being said, here is today’s market study.
The stock market’s big fluctuations
We’ve looked quite a bit at the stock market’s volatility recently.
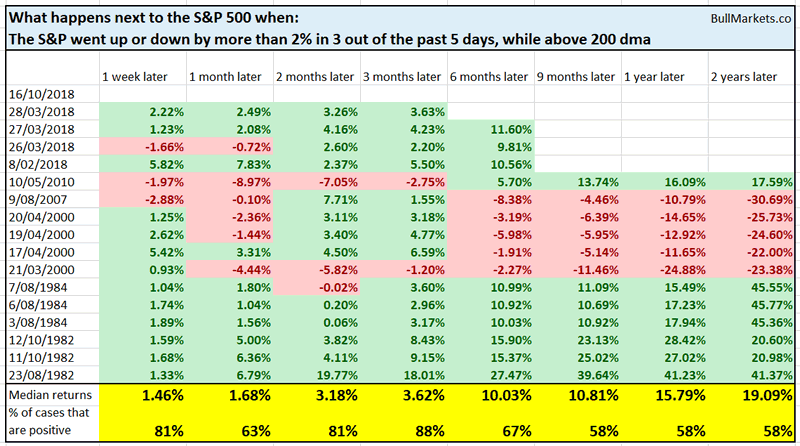
The S&P has gone up or down more than 2% in 3 out of the past 5 days, while above its 200 dma (on the last day).
Historically this meant that:
- The stock market was either near a long term bottom or near a long term top.
- Even in the worst case scenario (stock market near a long term top), the stock market was fine over the next 3 months.
My trading plan
I am 67% long SSO right now, based on the Medium-Long Term Model. The other 33% is in cash.
At this rate, the Medium-Long Term Model will turn long term bearish in Q2 2019.
Our recent studies demonstrate that even in the worst case scenario (i.e. bull market’s top is already in), the stock market will do fine in the next 2-3 months.
- I will reduce my position to 50% long SSO in January 2019.
- Then I will reduce my position size by 10% each month after January 2019.
- I will go to 100% cash when the Medium-Long Term Model turns bearish in mid-2019
Bear markets don’t happen in a straight line
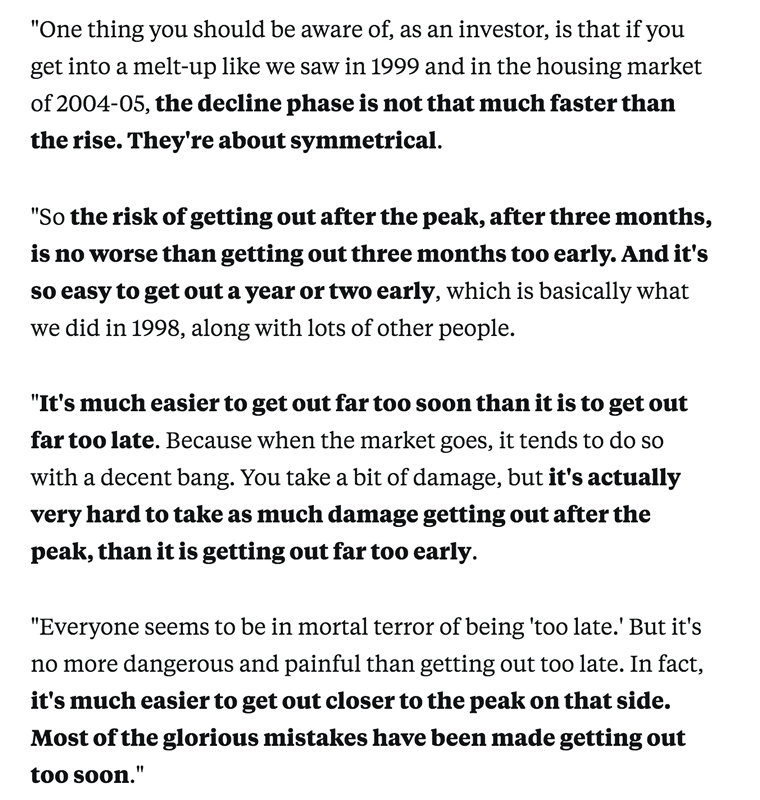
Jeremy Grantham (one of the best hedge fund managers in the past few decades) thinks that it’s better to sell on the way down than on the way up because:
- It’s far easier to sell “too early” than it is to sell “too late”. Selling too early is the same thing as selling too late (i.e. at a lower price than the bull market’s top).
- Bear markets don’t happen in a straight line. There are massive retracements along the way.
- Everyone is afraid of getting caught by the “mega-crash” (e.g. September-October 2008). In fact, those mega-crashes are ridiculously easy to avoid. They happen in the context of a recession. With the U.S. economy still showing solid GDP growth, a recession is unlikely to start the next year.
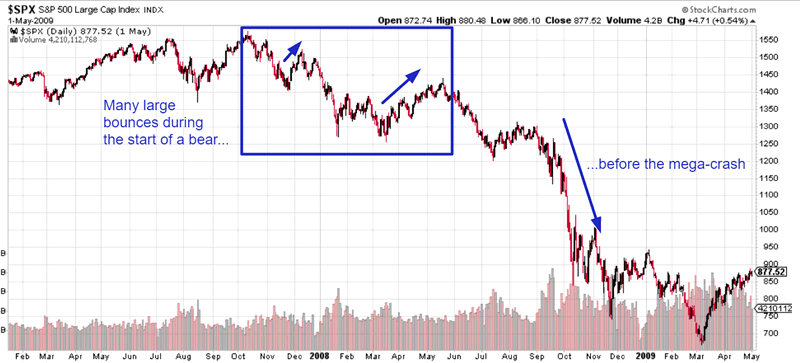
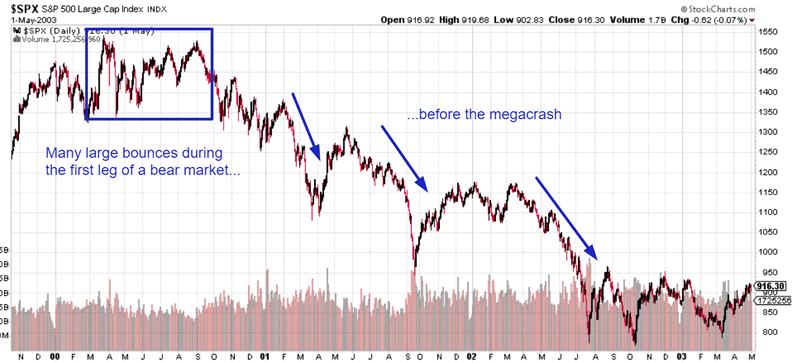
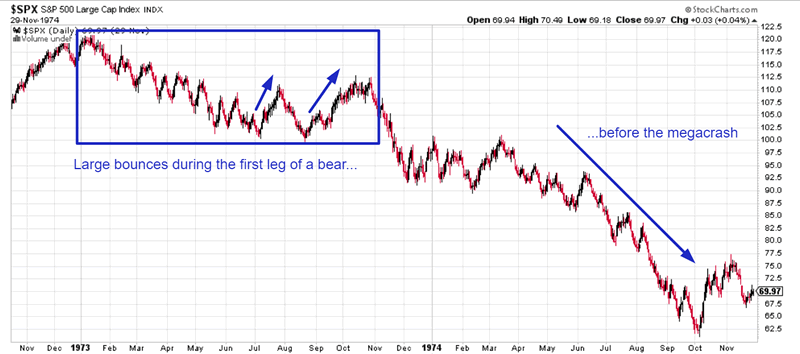
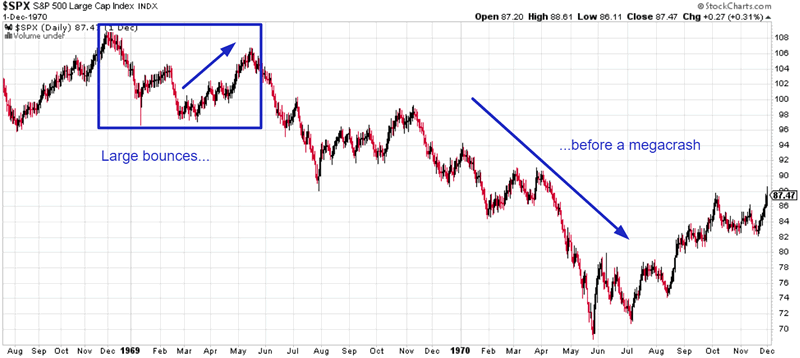
Jeremy Grantham is an advocate of selling on the bear market’s first big bounce rather than trying to predict the top because odds are, you’re going to sell too early before the top.
Click here for more market studies
*I highly recommend you read today’s market study on the U.S. Dollar. I don’t often examine the U.S. Dollar, and this analysis goes against what most people tell you about the USD.
By Troy Bombardia
I’m Troy Bombardia, the author behind BullMarkets.co. I used to run a hedge fund, but closed it due to a major health scare. I am now enjoying life and simply investing/trading my own account. I focus on long term performance and ignore short term performance.
Copyright 2018 © Troy Bombardia - All Rights Reserved
Disclaimer: The above is a matter of opinion provided for general information purposes only and is not intended as investment advice. Information and analysis above are derived from sources and utilising methods believed to be reliable, but we cannot accept responsibility for any losses you may incur as a result of this analysis. Individuals should consult with their personal financial advisors.
© 2005-2022 http://www.MarketOracle.co.uk - The Market Oracle is a FREE Daily Financial Markets Analysis & Forecasting online publication.