


Stock Market’s Short term Outlook is Slightly Bearish, But Medium term is Bullish
Stock-Markets / Stock Markets 2018 Nov 06, 2018 - 04:31 PM GMTBy: Troy_Bombardia

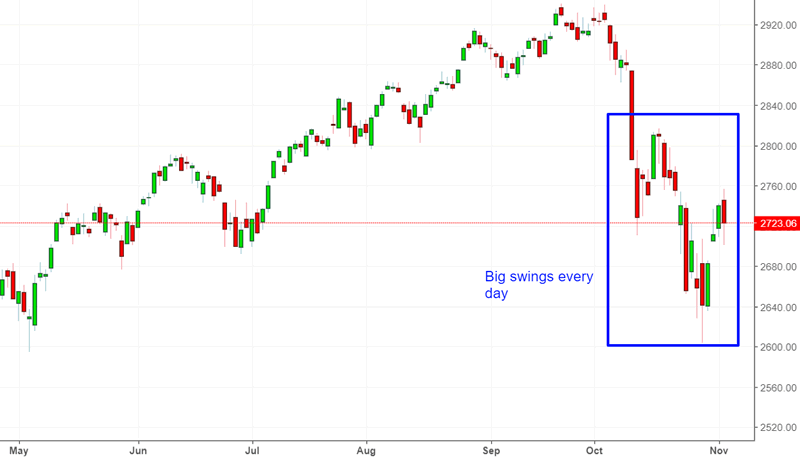
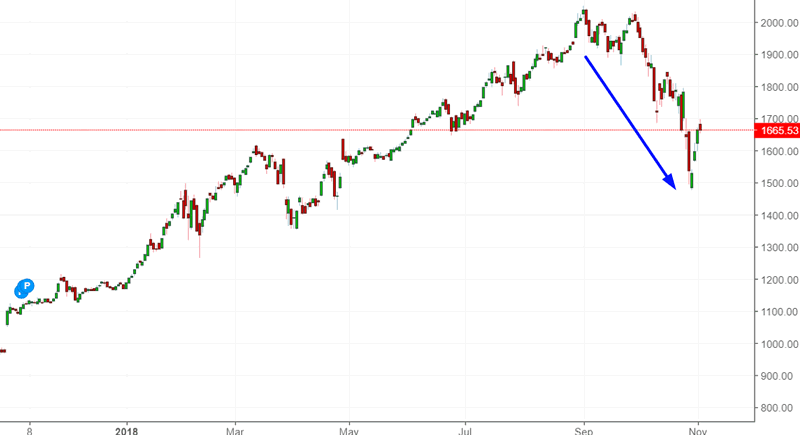
The U.S. stock market’s daily volatility is high, with large intraday swings. Here’s the S&P 500.
Let’s analyze the stock market’s price action by objectively quantifying technical analysis. For reference, here’s the random probability of the U.S. stock market going up on any given day, week, or month.

*Probability ≠ certainty.
The end of a very long losing streak
The current correction’s most notable feature is that small cap stocks have fallen much more than large caps.
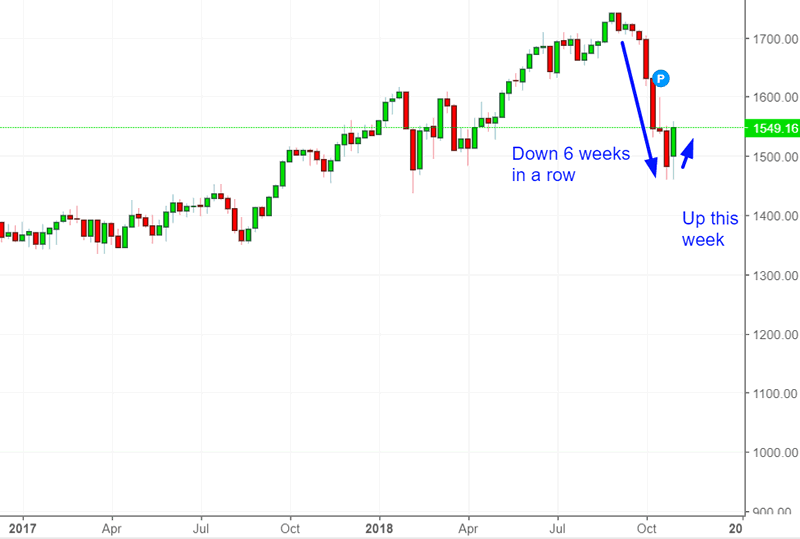
Here’s the Russell 2000 Index.
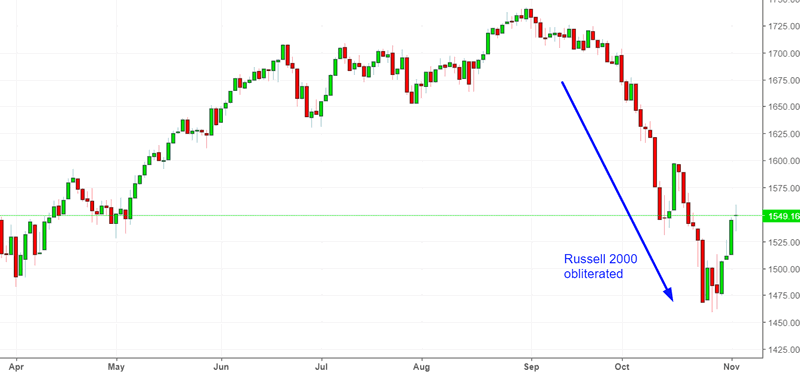
The Russell 2000 just ended its 6 week losing streak.
Here’s what happens next to the Russell (historically) when the Russell breaks a 6 week loss streak.
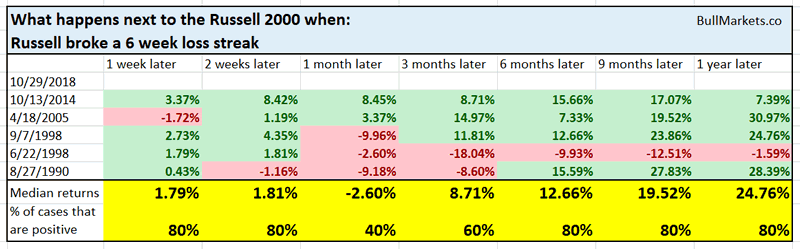
As you can see, the Russell tends to go up 3-12 months later. The 1998 case was an exception. The overall stock market went up from 1998 – 2000, but small caps lagged significantly.
A subdued VIX
The interesting thing about this correction is that while the S&P has fallen more than -10%, VIX didn’t even close above 30.
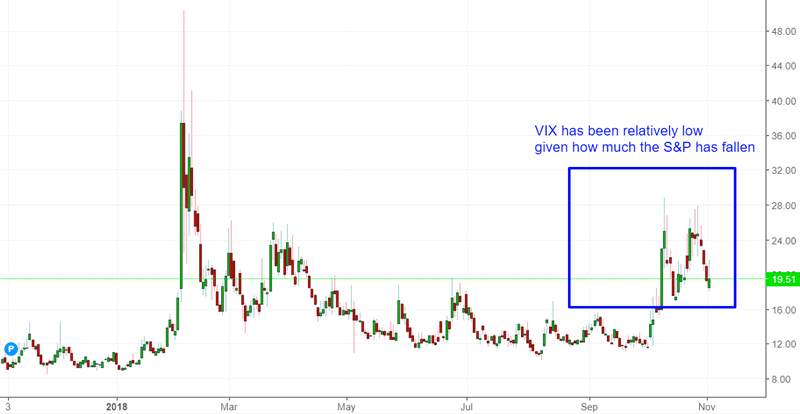
This is uncommon because VIX tends to rise much more when the S&P falls -10%.
Here’s what happened next to the S&P (historically) when the S&P fell more than -10% from a 1 year high while VIX is under 30 (first case in 3 months)
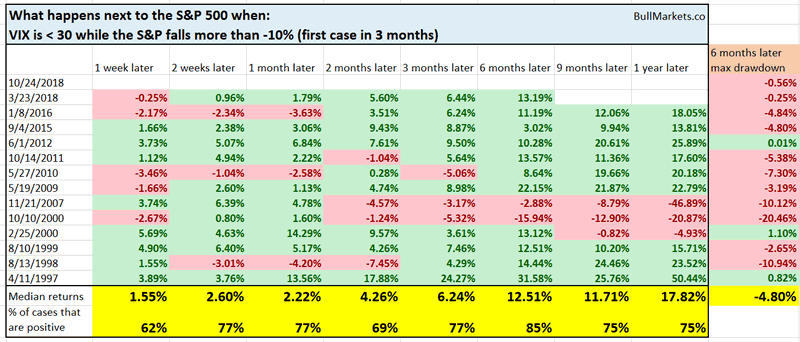
As you can see, the S&P tends to go up 6 months later.
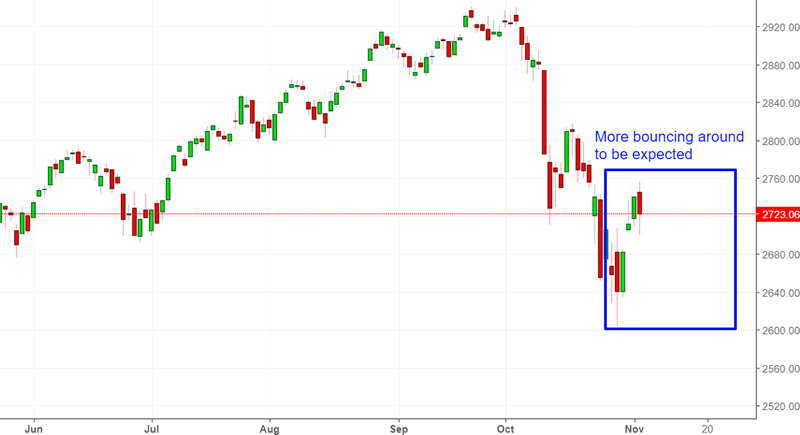
More signs that the stock market will retest its lows.
These quick corrections don’t usually see the S&P rally to new highs immediately. The stock market often bounces along the bottom, with big swings up and down before heading higher.
The S&P made a “bearish engulfing candle” today, whereby the S&P’s daily HIGH was > the previous day’s HIGH, and the daily LOW was < the previous day’s LOW.
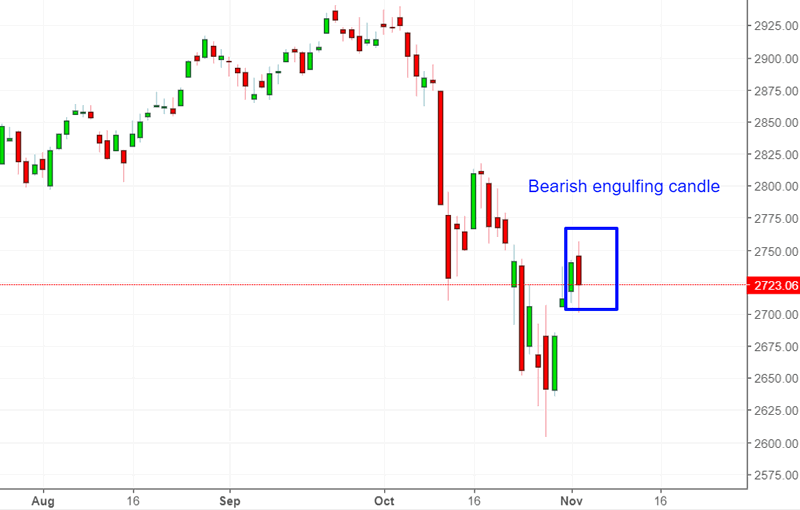
Such large bearish engulfing candles are uncommon.
Here’s what happened next to the S&P 500 (historically) when it made a bearish engulfing candle, the S&P went up >1% the previous day, and the S&P fell more than -0.6% today
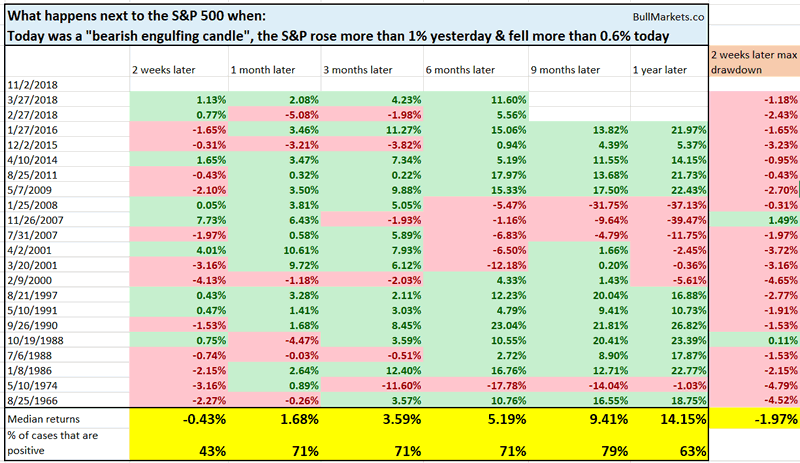
As you can see, the S&P tends to fall over the next 2 weeks, with a median drawdown of -2%
These are neither bullish nor bearish for the stock market
Whenever the stock market falls on a Friday, I see a lot of people saying “watch out in case next Monday crashes like October 19, 1987!” This is based on the idea that markets don’t bottom on Friday’s: a “down” Friday = a “down” Monday.
Recently, the U.S. stock market has fallen on a lot of Fridays. 6 of the past 7 Fridays have seen the S&P fall.
This has happened 51 times from 1927 – present. The S&P’s forward returns on every time frame (daily, weekly, monthly, yearly) were no different from random. This is neither bullish nor bearish for the stock market.
With that being said…
The S&P’s weekly LOW has been below its 20 weekly Bollinger Band for 2 consecutive weeks.
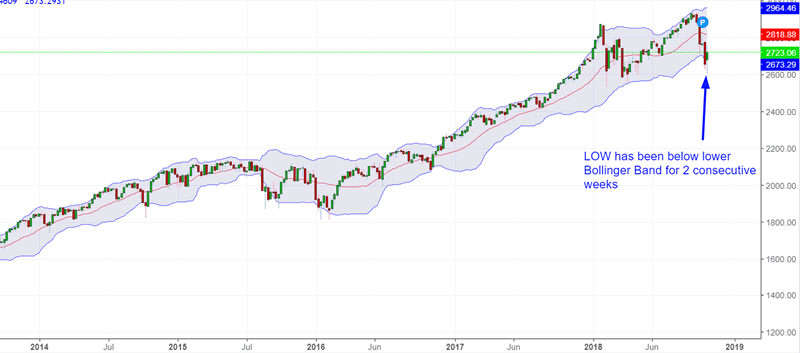
Does this mean that the stock market will bounce?
Here’s what happens next to the S&P (historically) when its weekly LOW is more than -1% below its lower Bollinger Band for 2 consecutive weeks (first case in 3 months).
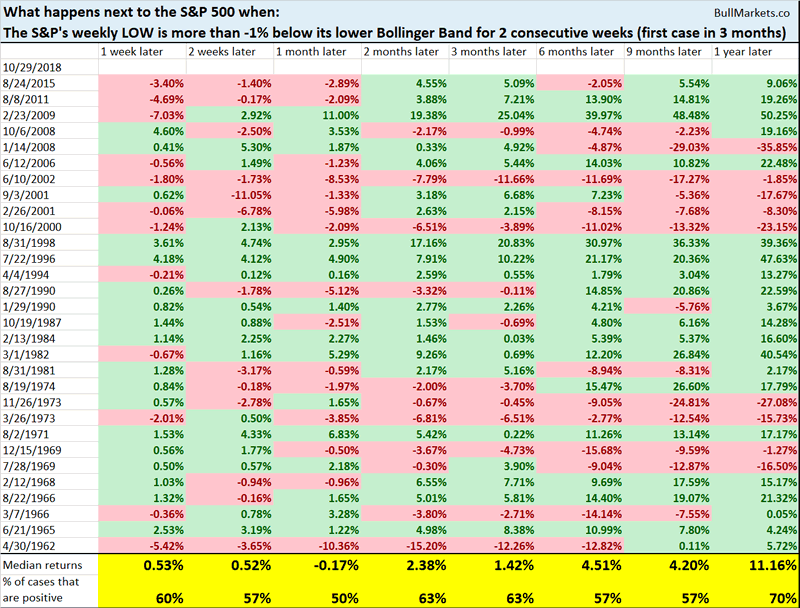
As you can see, the S&P’s forward returns are no better than random.
A long term bearish study, and why I’m not concerned
- XLY = consumer discretionary ETF
- XLP = consumer staple ETF
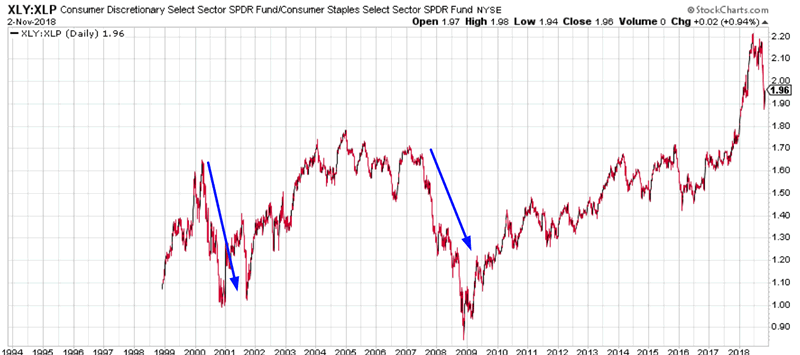
The XLY:XLP ratio tends to tank during a bear market because consumers cut discretionary spending much faster than necessary spending.
The XLY:XLP ratio has tanked during this correction.
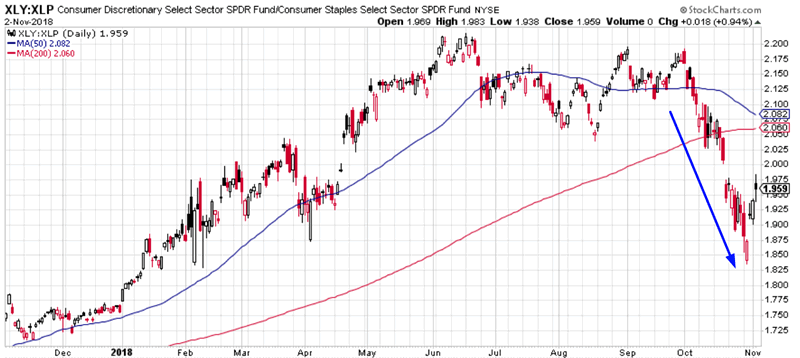
As you can see in the following chart, this ratio collapsed during the 2000-2002 bear market and 2007-2009 bear market.
Here’s what happens next to the S&P 500 (historically) when the XLY:XLP ratio falls more than -10% below its 50 day moving average (first time in 1 month)
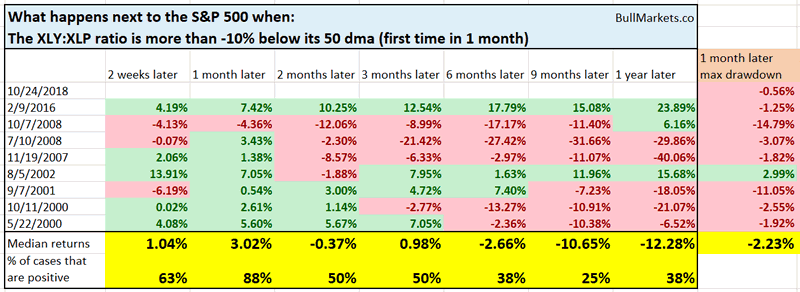
As you can see, with the exception of the February 2016 case, all of these signals happened in the context of a bear market. That’s why the S&P’s forward returns were so aweful.
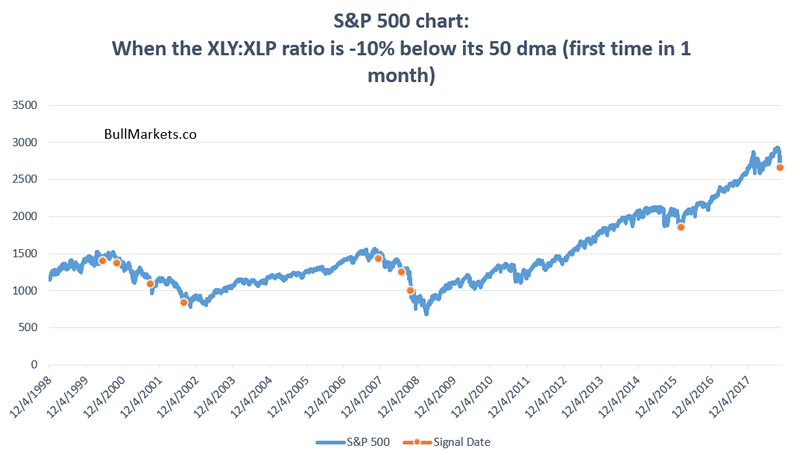
Here are the signal dates plotted onto a chart of the S&P 500.
But even in the bear market cases, the stock market tends to go up 1 month later.
I am not too concerned about this seemingly long term bearish study. Market studies that focus on sector ETFs aren’t exceptionally useful because the data is almost always limited from the 1998 – present. Limited data = limited usefulness.
Morever, individual sectors are heavily skewed by individual stocks. Amazon accounts for more than 20% of XLY
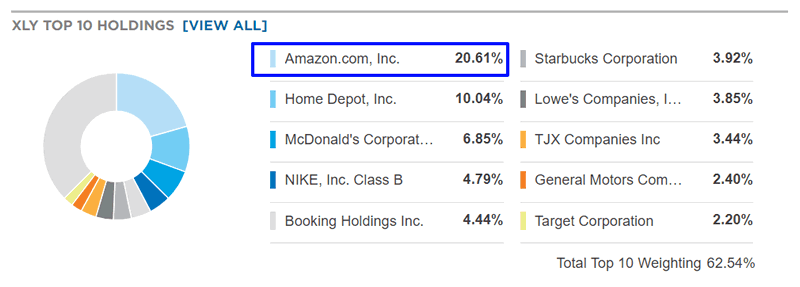
Amazon has fallen much more than the broad market during this correction, which is why XLY and the XLY:XLP ratio have tanked.
The falling XLY:XLP ratio isn’t a sign that consumers are shifting from discretionary to necessity spending. It symbolizes Amazon’s weakness.
Click here to see yesterday’s market study
Conclusion
Our discretionary technical outlook remains the same:
- The current bull market will peak sometime in Q2 2019.
- The medium term remains bullish (i.e. trend for the next 6-9 months). Volatility is extremely high right now. Since volatility is mean-reverting and moves in the opposite direction of the stock market, this is medium term bullish.
- The short term is slightly bearish. There’s a slightly >50% chance that the S&P will retest its lows from last week. This probability isn’t exceptionally high, so I wouldn’t bank on it.
- When the stock market’s short term is unclear (as it is most of the time), focus on the medium term. Step back and look at the big picture. Don’t lose yourself in a sea of noise.
Our discretionary outlook is usually, but not always, a reflection of how we’re trading the markets right now. We trade based on our clear, quantitative trading models, such as the Medium-Long Term Model.
Members can see exactly how we’re trading the U.S. stock market right now based on our trading models.
Click here for more market studies
By Troy Bombardia
I’m Troy Bombardia, the author behind BullMarkets.co. I used to run a hedge fund, but closed it due to a major health scare. I am now enjoying life and simply investing/trading my own account. I focus on long term performance and ignore short term performance.
Copyright 2018 © Troy Bombardia - All Rights Reserved
Disclaimer: The above is a matter of opinion provided for general information purposes only and is not intended as investment advice. Information and analysis above are derived from sources and utilising methods believed to be reliable, but we cannot accept responsibility for any losses you may incur as a result of this analysis. Individuals should consult with their personal financial advisors.
© 2005-2022 http://www.MarketOracle.co.uk - The Market Oracle is a FREE Daily Financial Markets Analysis & Forecasting online publication.