


Will Crude Oil Price Find Support Near $60?
Commodities / Crude Oil Nov 13, 2018 - 10:52 AM GMTBy: Chris_Vermeulen

Our research team warned of this move in Crude Oil back on October 7, 2018. At that time, we warned that Oil may follow a historical price pattern, moving dramatically lower and that lows near $65 may become the ultimate bottom for that move. Here we are with a price below that level and many are asking “where will it go from here?”.
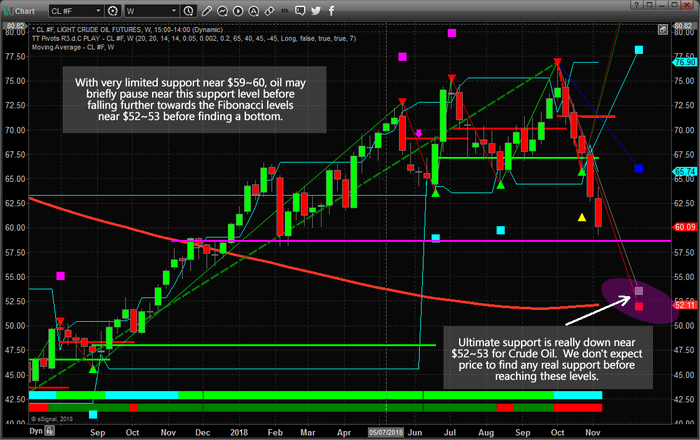
We believe the support near $65, although clearly broken, may eventually become resistance for a future upside price move. Our proprietary Fibonacci price modeling system is suggesting a new target near $52~53 and we believe this downside move in Oil is far from over at this point.
The current global climate for Oil is that suppliers are pumping more and more oil into the market at a time when, historically, prices should continue to decline. One of our research tools includes the ability to identify overall bias models for each week, month or quarter. Historically, Oil is dramatically weaker in the month of November and relatively flat for the month of December.
Analysis for the month of November = 11
- Total Monthly Sum : -44.52000000000001 across 36 bars
Analysis for the month of December = 12
- Total Monthly Sum : -0.699999999999922 across 36 bars
We believe the price of oil will continue to drift lower to target the $52~53 Fibonacci support level before attempting to find any real price support. This equates to an addition -6 to -8% price decline for skilled traders. We will alert you with a new research post as this downward price move continues or new research becomes available.
We have been calling these types of market moves all year and recently called the top in the US Equity markets nearly 40 days before it happened. Want to know what we think is going to happen for the rest of 2018 and into early 2019? Visit www.TheTechnicalTraders.com/FreeResearch/ to read all of our public research posts. Isn’t it time you invested in a team of researchers and tools to assist you in finding greater trading success?
Chris Vermeulen
www.TheTechnicalTraders.com
Chris Vermeulen has been involved in the markets since 1997 and is the founder of Technical Traders Ltd. He is an internationally recognized technical analyst, trader, and is the author of the book: 7 Steps to Win With Logic
Through years of research, trading and helping individual traders around the world. He learned that many traders have great trading ideas, but they lack one thing, they struggle to execute trades in a systematic way for consistent results. Chris helps educate traders with a three-hour video course that can change your trading results for the better.
His mission is to help his clients boost their trading performance while reducing market exposure and portfolio volatility.
He is a regular speaker on HoweStreet.com, and the FinancialSurvivorNetwork radio shows. Chris was also featured on the cover of AmalgaTrader Magazine, and contributes articles to several leading financial hubs like MarketOracle.co.uk
Disclaimer: Nothing in this report should be construed as a solicitation to buy or sell any securities mentioned. Technical Traders Ltd., its owners and the author of this report are not registered broker-dealers or financial advisors. Before investing in any securities, you should consult with your financial advisor and a registered broker-dealer. Never make an investment based solely on what you read in an online or printed report, including this report, especially if the investment involves a small, thinly-traded company that isn’t well known. Technical Traders Ltd. and the author of this report has been paid by Cardiff Energy Corp. In addition, the author owns shares of Cardiff Energy Corp. and would also benefit from volume and price appreciation of its stock. The information provided here within should not be construed as a financial analysis but rather as an advertisement. The author’s views and opinions regarding the companies featured in reports are his own views and are based on information that he has researched independently and has received, which the author assumes to be reliable. Technical Traders Ltd. and the author of this report do not guarantee the accuracy, completeness, or usefulness of any content of this report, nor its fitness for any particular purpose. Lastly, the author does not guarantee that any of the companies mentioned in the reports will perform as expected, and any comparisons made to other companies may not be valid or come into effect.
Chris Vermeulen Archive |
© 2005-2022 http://www.MarketOracle.co.uk - The Market Oracle is a FREE Daily Financial Markets Analysis & Forecasting online publication.