


Defensive Stock Sectors Outperforming, Just Like During the Dot-com Bubble
Stock-Markets / Stock Markets 2018 Nov 15, 2018 - 06:25 AM GMTBy: Troy_Bombardia

 We’re seeing something very interesting right now. Most of our long term market studies are still bullish, but several are turning bearish. This is typically what happens in the last year of a bull market, when the market slowly starts to roll over into a bear market. (Remember that “slowly rolling over” includes plenty of up and down volatility).
Let’s determine the stock market’s most probable direction by objectively quantifying technical analysis. For reference, here’s the random probability of the U.S. stock market going up on any given day, week, or month.

*Probability ≠ certainty.
Consumer Staples are outperforming
Consumer Staples is a defensive sector that outperforms during times of market stress.
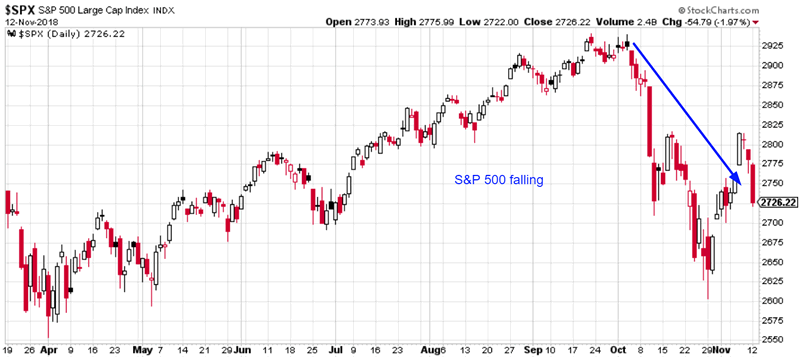
However, it’s not common for Consumer Staples to go up significantly while the stock market falls. Consumer Staples has gone up since October while the broad stock market (S&P 500) has fallen.
Here’s the S&P 500.
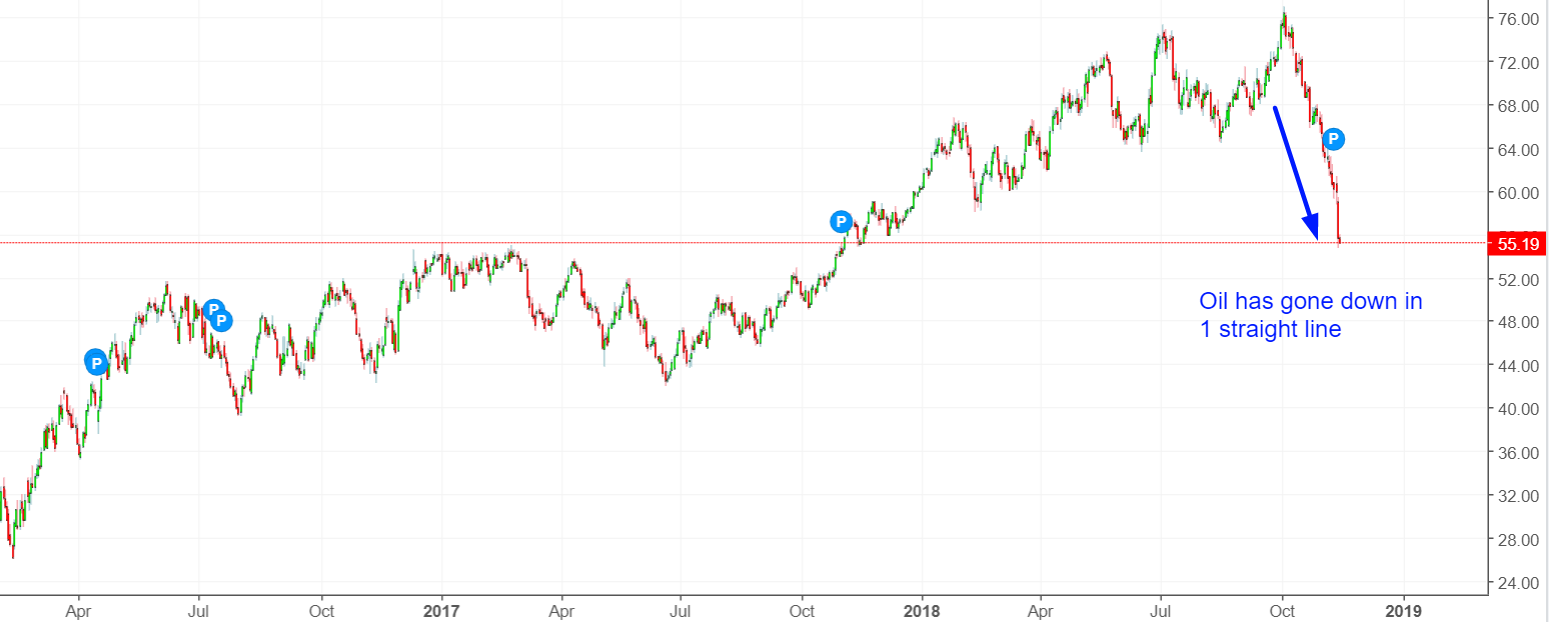
Here’s XLP.
Here’s what happens next to the S&P 500 (historically) when XLP goes up more than 7% in the past month while the S&P 500 falls.
*Data from 1998 – present
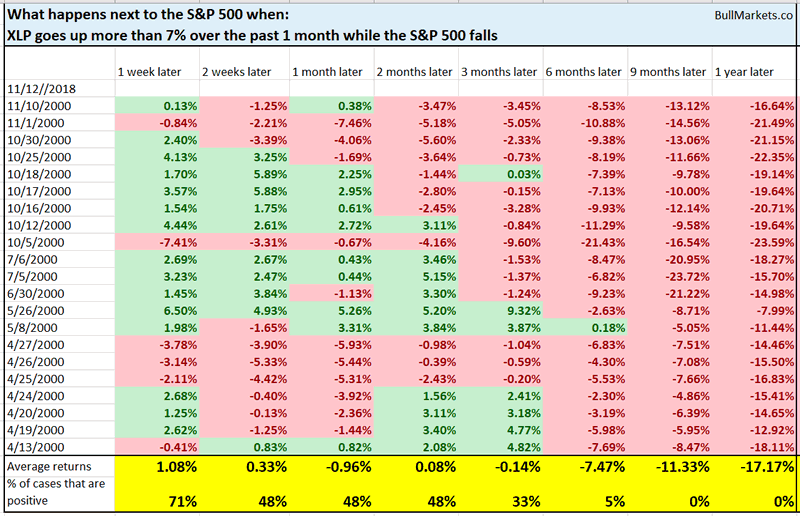
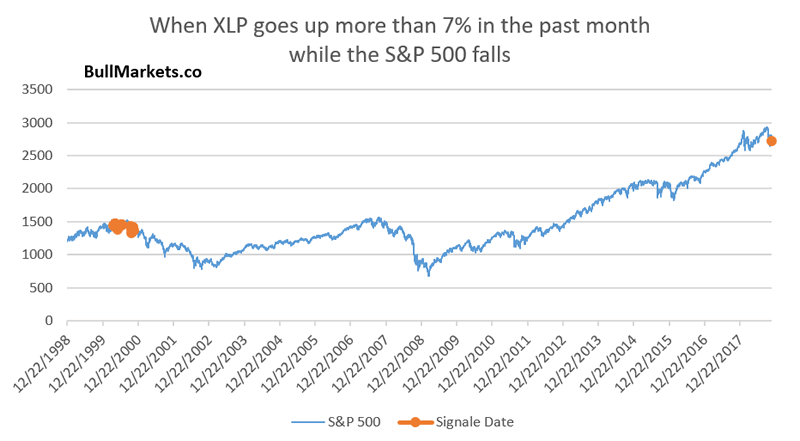
As you can see, this is definitely a sign of late-cycle behavior for the stock market. During the 1990s bull market, this first happened in April 2000. The stock market rallied over the next 5 months before falling off a cliff.
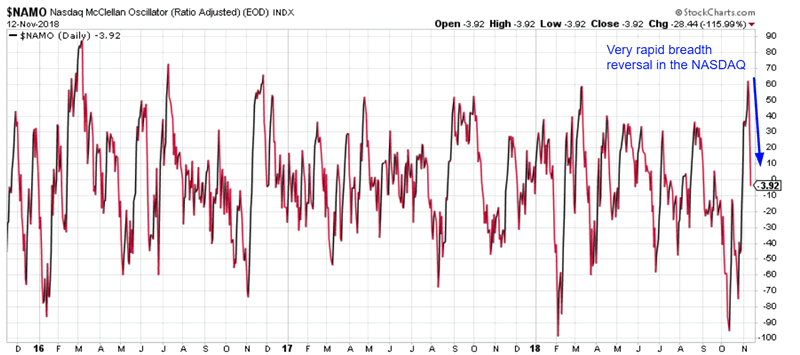
NAMO
NAMO is the NASDAQ’s McClellan Oscillator (breadth indicator). It fell from more than +60 to less than 0 in 1 week, which is a very rapid downwards reversal.
Going into this study, I thought that this would be a short term bearish factor for the U.S. stock market.
It isn’t.
Here’s what happened next to the S&P 500 when NAMO went from more than 60 to less than 0 in 1 week.
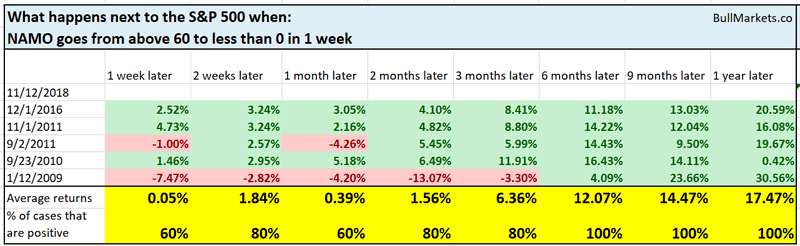
Interestingly enough, the stock market does well over the next 6-12 months.
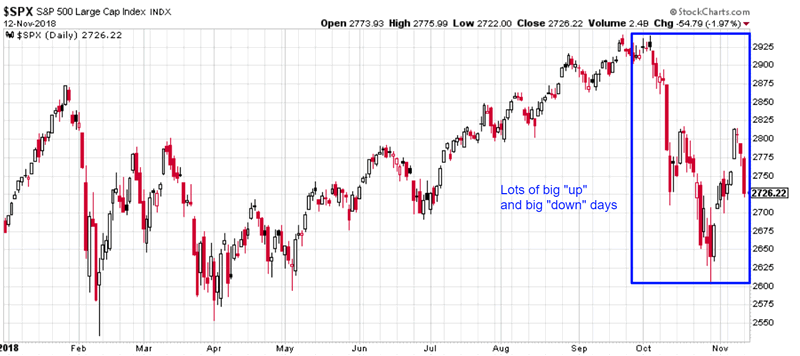
Lots of volatility
The stock market has been very volatile over the past 1.5 months. Volatility is mean-reverting and generally moves in the opposite direction of the stock market.
Here’s what happens next to the S&P 500 when there have been 6 or more +1.9% and -1.9% days in the past 30 days.
*Data from 1950 – present
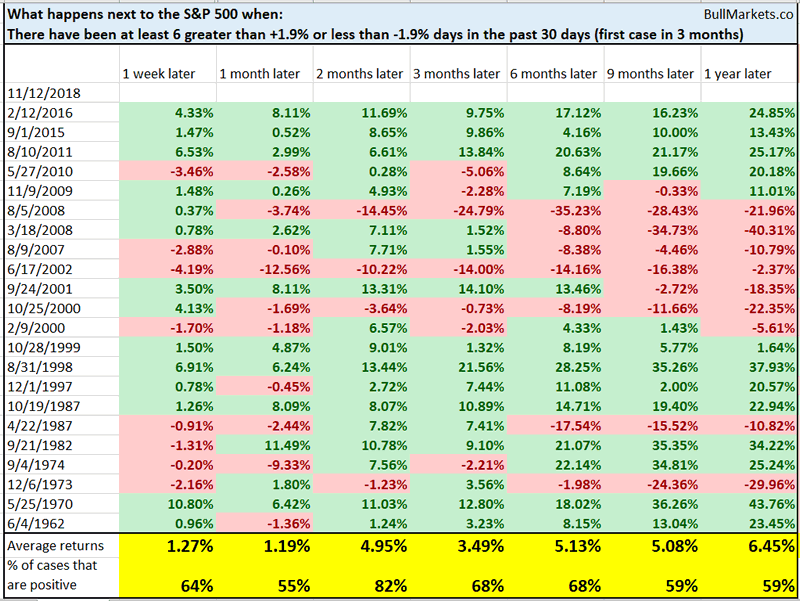
As you can see, the stock market tends to do well over the next 2 months, but returns start to deteriorate after 9 months. This fits with our “bull market top in Q2 2019” theme.
Will tech start to outperform large caps?
After outperforming large caps for most of this year, tech has underperformed significantly over the past few months. As a result, the Dow:NASDAQ ratio has gone up significantly.

Here’s what happens next to the Dow:NASDAQ ratio (historically) when the ratio is more than 5% above its 200 day moving average.
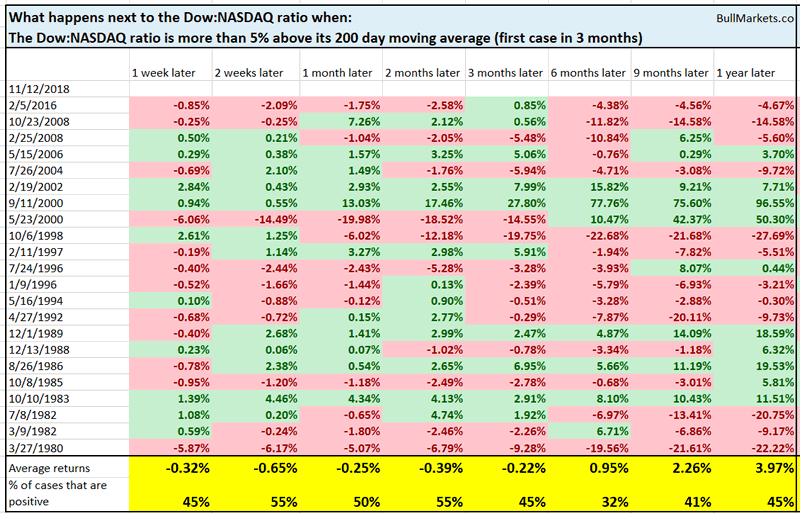
As you can see, the ratio has a tendency to fall over the next 6 months, which suggests that tech (NASDAQ) will outperform large caps (Dow).
Oil is not looking good
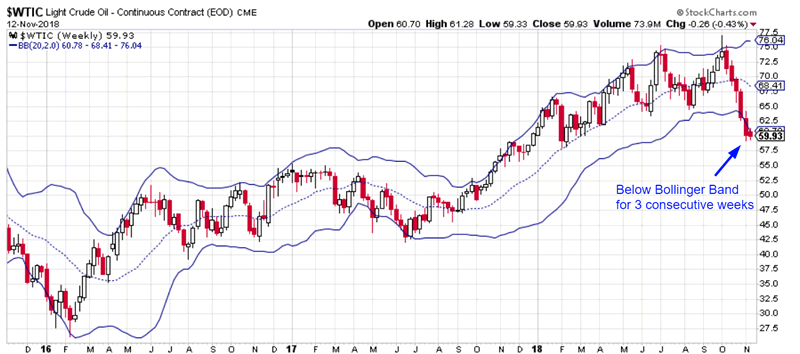
Oil has gone down 11 days in a row, a record loss streak. Here’s a better way to look at oil.
If oil doesn’t rise this week, it’ll be below its lower weekly Bollinger Band (20 sma, 2 standard deviations) for 3 consecutive weeks.
Here’s what happened next to oil (historically) when it was below its lower Bollinger Band for 3 consecutive weeks.
*Data from 1983 – present
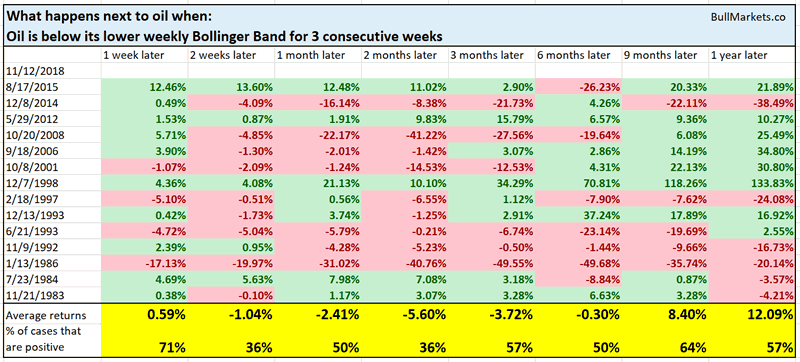
As you can see, this is not a medium term bullish sign for oil. Oil will probably bounce and then head lower (i.e. a momentum divergence).
Watch out in 2019
Goldman thinks that the S&P 500’s earnings growth will fall significantly in 2019 and 2020.
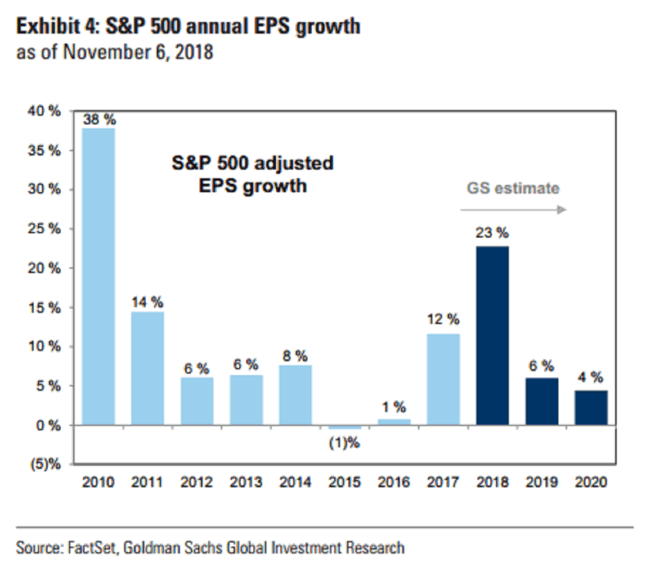
This isn’t bearish on its own. There were plenty of bull market years (e.g. 2012-2016) in which the S&P saw single-digit profit growth. However, this is a long term bearish sign considering that we are this late in the bull market’s cycle. The next decline in earnings growth will probably result in negative earnings growth (i.e. the end of the bull market).
Tariffs
There are plenty of things to worry about in 2019, but tariffs aren’t one of them. According to CNBC, tariffs are having a negative impact on only about 9% of companies.
Click here to see yesterday’s market study
Conclusion
Our discretionary technical outlook remains the same:
- The current bull market will peak sometime in Q2 2019.
- The medium term remains bullish (i.e. trend for the next 6-9 months).
- The short-medium term leans bearish. There’s a >50% chance that the S&P will fall in the next few weeks.
Focus on the medium term and long term. The short term is usually just noise.
Our discretionary outlook is usually, but not always, a reflection of how we’re trading the markets right now. We trade based on our clear, quantitative trading models, such as the Medium-Long Term Model.
Members can see exactly how we’re trading the U.S. stock market right now based on our trading models.
Click here for more market studies
By Troy Bombardia
I’m Troy Bombardia, the author behind BullMarkets.co. I used to run a hedge fund, but closed it due to a major health scare. I am now enjoying life and simply investing/trading my own account. I focus on long term performance and ignore short term performance.
Copyright 2018 © Troy Bombardia - All Rights Reserved
Disclaimer: The above is a matter of opinion provided for general information purposes only and is not intended as investment advice. Information and analysis above are derived from sources and utilising methods believed to be reliable, but we cannot accept responsibility for any losses you may incur as a result of this analysis. Individuals should consult with their personal financial advisors.
© 2005-2022 http://www.MarketOracle.co.uk - The Market Oracle is a FREE Daily Financial Markets Analysis & Forecasting online publication.