


Active Managers are Bearish on Stocks. A Bullish Contrarian Sign
Stock-Markets / Stock Markets 2018 Nov 16, 2018 - 04:53 PM GMTBy: Troy_Bombardia

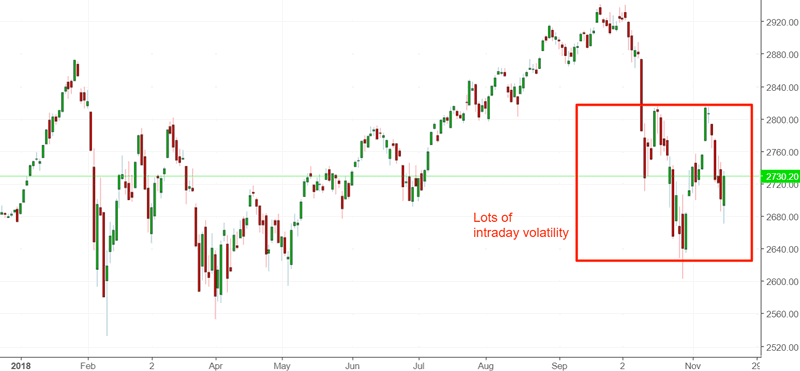
The stock market has been very volatile lately, swinging up and down more than 1% on many days. During times of high intraday volatility, it’s best to ignore the short term and focus on the bigger picture.
Let’s determine the stock market’s most probable direction by objectively quantifying technical analysis. For reference, here’s the random probability of the U.S. stock market going up on any given day, week, or month.

*Probability ≠ certainty.
Active managers are bearish on stocks
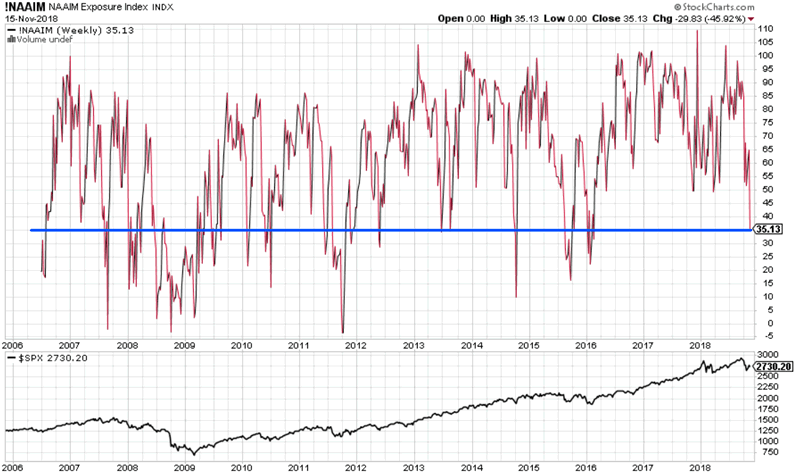
NAAIM measures the average exposure to U.S. stocks by active investment managers. This is a contrarian signal because most active investment managers (like most hedge funds) underperform buy and hold. They get very greedy after stocks go up and get bearish after stocks go down.
NAAIM is very low right now, below 36%
Here’s what happened next to the S&P 500 (historically) when NAAim fell below 36%
*Data from 2006 – present
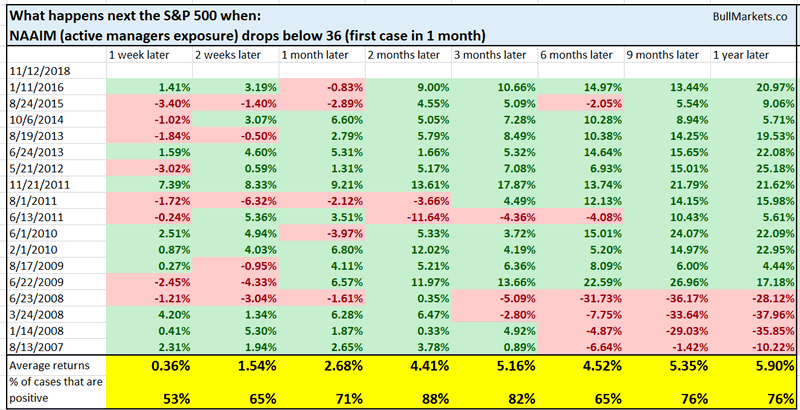
As you can see, the stock market tends to go up over the next 2-3 months, even during 2008. Afterwards, forward returns start to deteriorate.
Put/Call remains elevated
The Total Put/Call Ratio (a sentiment indicator) remains elevated. Its 30 day moving average is now above 1.1
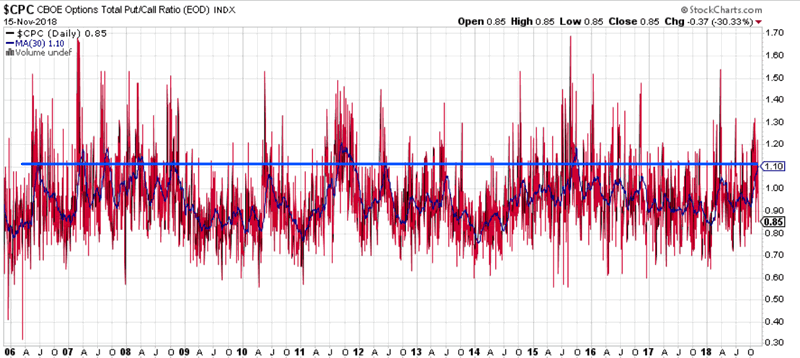
Here’s what happened next to the S&P 500 when the Put/Call Ratio’s 30 day moving average was above 1.1
*Data from 1996 – present
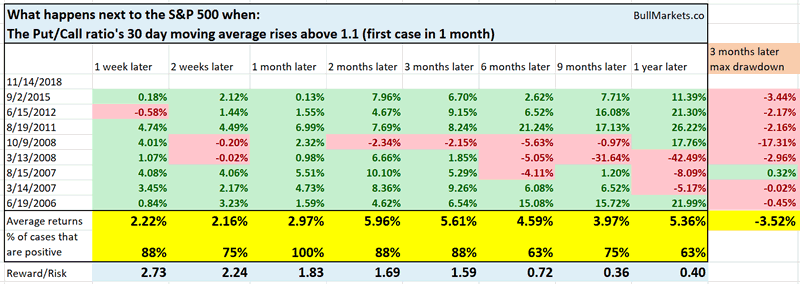
As you can see, the stock market tends to go up over the next 1-3 months.
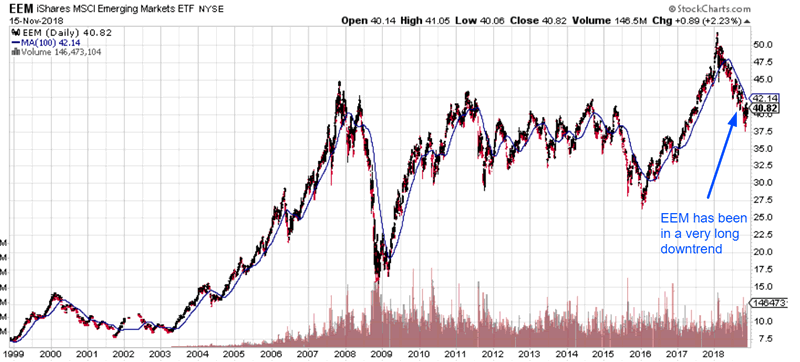
Emerging markets’ very long downtrend
Despite the recent bounce, emerging markets remain in a very long downtrend
From 1996 – present, there have only been 3 cases in which EEM (emerging markets ETF) was below its 200 day moving average for at least 148 consecutive days:
- November 15, 2018
- January 21, 2009
- November 10, 2000
Here are those signal dates.
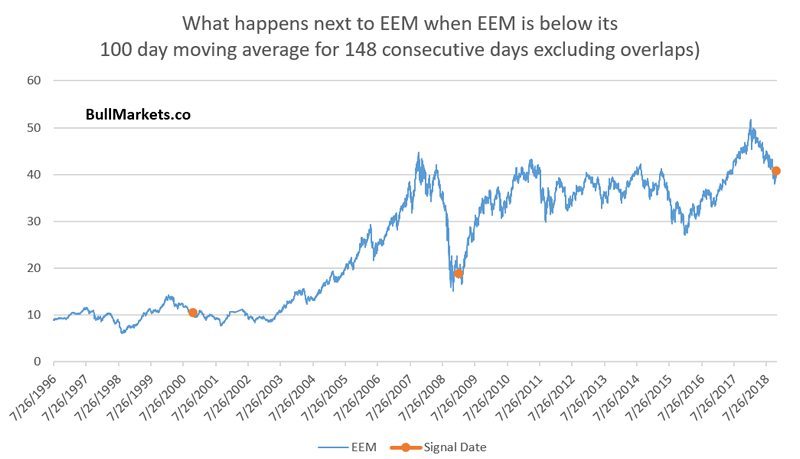
Here’s the interesting point. There was 1 long term bearish date (2000) and 1 long term bullish date (2009). Even in the bearish case (2000), EEM fell less than the S&P 500 during the next bear market. Perhaps this is becaues EEM already fell so much, that when the S&P’s bear market finally came, EEM didn’t have as much room left to fall.
Anyways, food for thought.
Click here to see yesterday’s market study
Conclusion
Our discretionary technical outlook remains the same:
- The current bull market will peak sometime in Q2 2019.
- The medium term remains bullish (i.e. approximately next half year).
- The short-medium term is mostly a 50-50 bet, although there is a slight bearish lean to it.
Focus on the medium term and long term. The short term is usually just noise.
Our discretionary outlook is usually, but not always, a reflection of how we’re trading the markets right now. We trade based on our clear, quantitative trading models, such as the Medium-Long Term Model.
Members can see exactly how we’re trading the U.S. stock market right now based on our trading models.
Click here for more market studies
By Troy Bombardia
I’m Troy Bombardia, the author behind BullMarkets.co. I used to run a hedge fund, but closed it due to a major health scare. I am now enjoying life and simply investing/trading my own account. I focus on long term performance and ignore short term performance.
Copyright 2018 © Troy Bombardia - All Rights Reserved
Disclaimer: The above is a matter of opinion provided for general information purposes only and is not intended as investment advice. Information and analysis above are derived from sources and utilising methods believed to be reliable, but we cannot accept responsibility for any losses you may incur as a result of this analysis. Individuals should consult with their personal financial advisors.
© 2005-2022 http://www.MarketOracle.co.uk - The Market Oracle is a FREE Daily Financial Markets Analysis & Forecasting online publication.