


Is Gold Under or Overpriced?
Commodities / Gold and Silver 2018 Nov 17, 2018 - 11:32 AM GMTBy: Arkadiusz_Sieron

 Have you heard about the Everything Bubble? Some analysts believe that after the dot-com bubble of the 1990s and the housing bubble of the 2000s, we are in the middle of a price bubble in virtually all asset classes simultaneously caused by the Fed’s unusually easy monetary policy with ultra low interest rates. Although we agree that the US central bank maintained federal funds rate too low for too long, the narrative about a dangerous bubble inflating in a wide variety of countries, industries, and assets does not make sense. The bubble means that the price of an asset deviates from the fundamental value, increasing excessively, to a much greater extent than on other markets. It should be now clear that the existence of overvalued assets necessarily means that other assets are undervalued, so there can’t be the ‘everything bubble’. Sorry, but those who wait for the total asset apocalypse might be disappointed.
OK, but what about gold? Is its price too low or too high relative to stocks and bonds? Let’s examine it and find out who is right: gold bulls or bears? The chart below displays the ratio of gold prices to the S&P 500 Index.
Chart 1: Gold to S&P 500 Index ratio from April 1968 to September 2018.
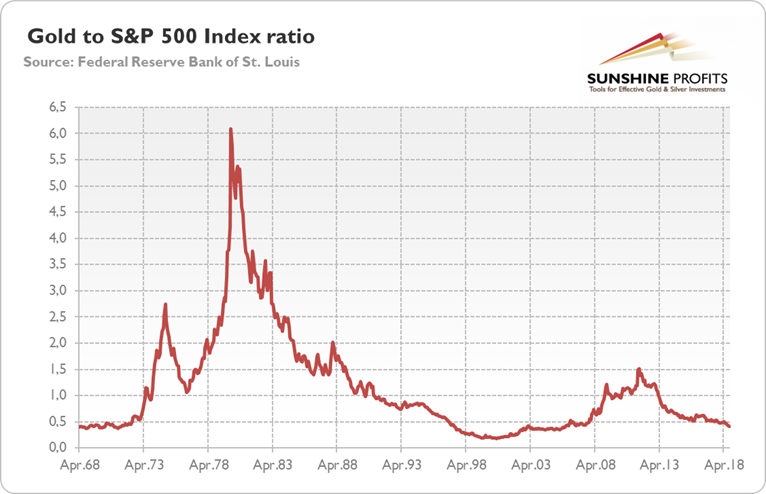
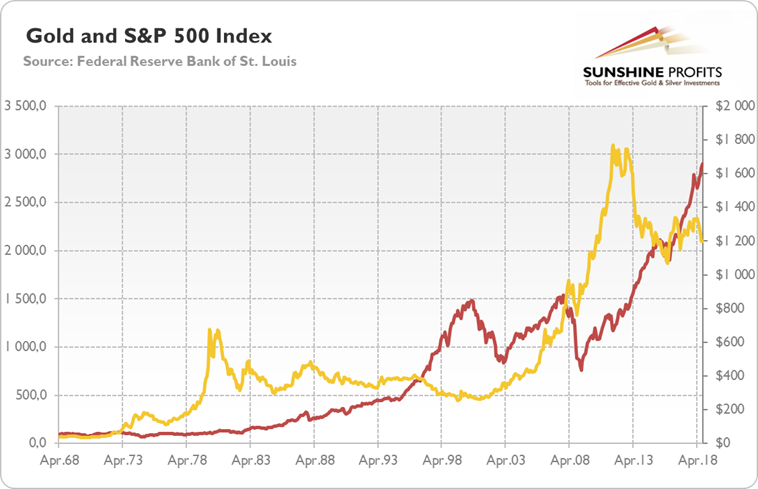
As one can see, the ratio is now around 0.41, which is rather low. The historical average amounts to 1.14, almost three times higher. It may indicate that gold is significantly underpriced compared to US stocks. However, let’s note that the inflationary decades of 1970s and 1980s strongly affect the results. Gold enjoyed a tremendous bull market in the 70s and early 80s., as the next chart shows. When we remove that period from the analysis and start from the 1990s, the average drops to 0.64 – still higher, but not so much. The chart below also suggests that the current low level of gold-to-stock ratio results not from mediocre gold prices, but rather from elevated stock valuations.
Chart 2: Gold prices (yellow line, right axis) and S&P 500 Index (red line, left axis) from April 1968 to September 2018.
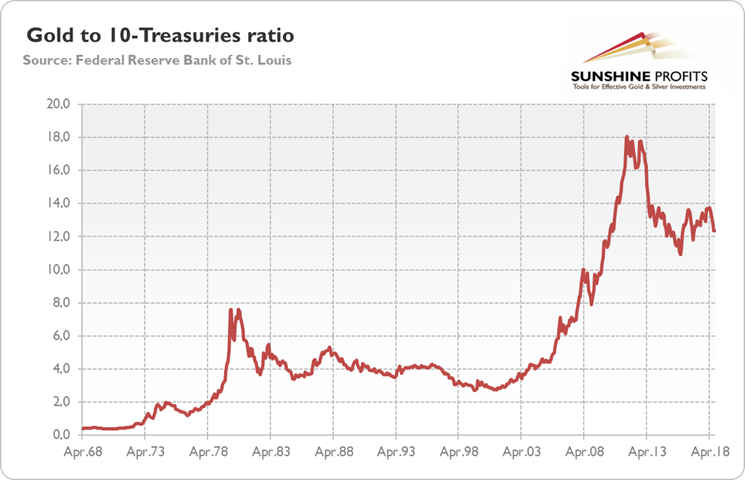
And what about bonds? Let’s look at the chart below. As one can see, gold now seems to be overpriced relative to bonds. The historical average is 5.44, while the current reading of the ratio amounts to 12.36.
Chart 3: Gold to 10-Treasuries ratio from April 1968 to September 2018.
The next chart displays the gold and 10-Treasuries prices (quoted as 100 minus the yield). It suggest that although the bond prices are quite high, the gold prices are relatively elevated due to the amazing rally in the 2000s.
Chart 4: Gold prices (yellow line; right axis) and bond prices (red line; left axis; 100 minus yield) from April 1968 to September 2018.
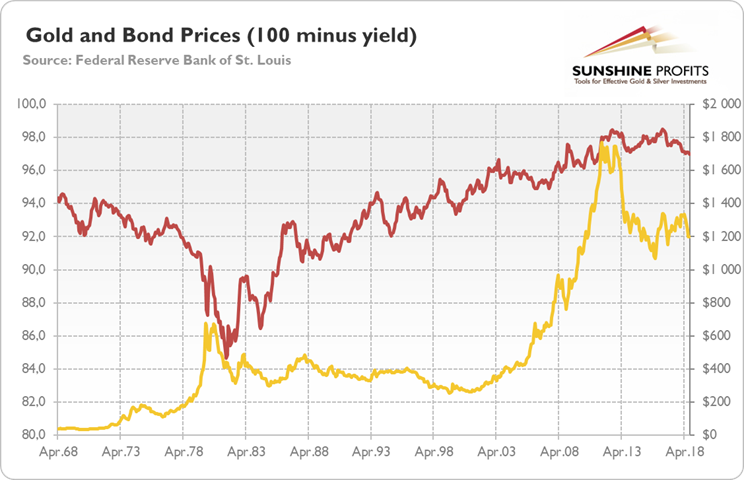
So we have contradictory indications. However, investors should remember that all comparison to bond prices have limited use, as bond prices are quoted as 100 minus yield. It means that while the prices of other assets will increase over time, the bond quotes will be not very distant from their face values (there is pull to par).
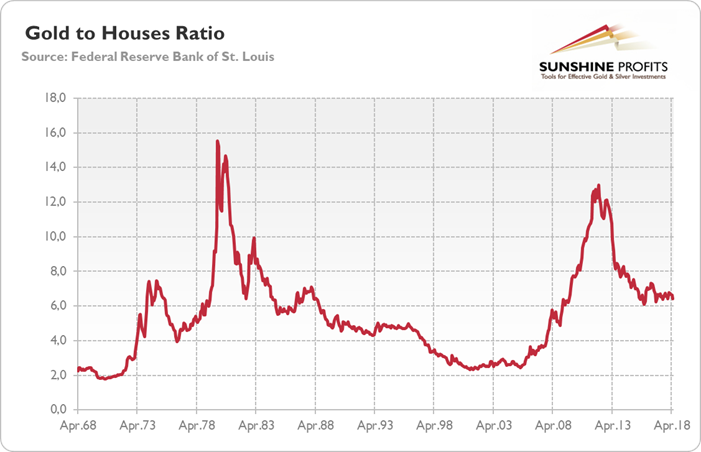
But, as we mentioned at the beginning, one can argue that we are in “everything bubble” and all financial assets, or at least both stocks and bonds, are overvalued. So let’s compare the yellow metal to houses, which are another tangible and alternative asset class. The next chart points to the ratio of gold prices vs. home prices, reflected by the Private Housing Construction Price Index from 1968 to 1974 and S&P/CoreLogic/Case-Shiller US National Home Price Index from 1975 to 2018 (both data series came from Robert Shiller’s online database).
As one can see, the current value of the ratio, 6.62, is above the historical average, i.e., 5.48, which could suggest that gold is a bit overvalued relatively to property prices.
Chart 5: Gold to Home Prices (Gold to Private Housing Construction Price Index ratio from April 1968 to December 1974 and Gold to S&P/CoreLogic/Case-Shiller Home Price Index ratio from January 1975 to May 2018).
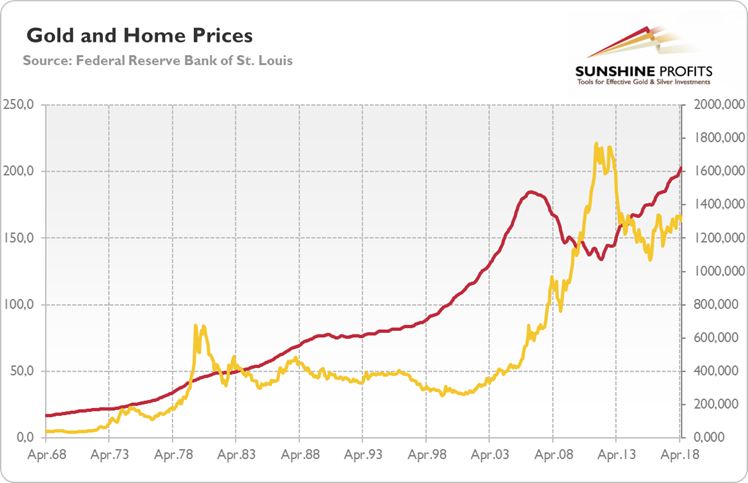
However, investors should remember that we had the housing bubble in the early 2000s, which means that the average would be higher, if the real estates were not artificially propped up. As the next chart shows, when the bubble burst, gold shined. But the real estate has outperformed gold since 2012 due to the economic recovery and increased risk appetite.
Chart 6: Gold prices (yellow line; right axis) and home prices (red line; left axis; PHCPI and S&P/Case-Shiller) from April 1968 to May 2018.
The key takeaway is that gold seems to be underpriced when compared to the US stocks, while overvalued when compared to the American real estates (and perhaps bonds as well, but this comparison is less conclusive). What does it imply for the gold outlook? Well, not as much as you might think. The reason is that the regression toward the mean does not fully apply to the gold market – at least unless someone considers the price of gold as the resultant of completely random events. We prefer a casual-realistic approach, which pays attention to broad macroeconomic context, to simple mechanistic one, which focuses solely on data series.
In other words, what really matters is the reason for high share prices compared to other assets, including gold, and it’s low interest rates. In such macroeconomic environment, stocks are simply more attractive than bonds. Now, yields are rising, which may hit equities, which are dangerously lofty relative to gold or home prices. But does it mean that investors will turn to the bullion? Not necessarily, as coupon-bearing bonds will look more attractive. Higher demand for US Treasuries, strengthened additionally by problems of some emerging markets, would support the greenback and be a headwind for the yellow metal.
Thank you.
If you enjoyed the above analysis and would you like to know more about the gold ETFs and their impact on gold price, we invite you to read the April Market Overview report. If you're interested in the detailed price analysis and price projections with targets, we invite you to sign up for our Gold & Silver Trading Alerts . If you're not ready to subscribe at this time, we invite you to sign up for our gold newsletter and stay up-to-date with our latest free articles. It's free and you can unsubscribe anytime.
Arkadiusz Sieron
Sunshine Profits‘ Market Overview Editor
Disclaimer
All essays, research and information found above represent analyses and opinions of Przemyslaw Radomski, CFA and Sunshine Profits' associates only. As such, it may prove wrong and be a subject to change without notice. Opinions and analyses were based on data available to authors of respective essays at the time of writing. Although the information provided above is based on careful research and sources that are believed to be accurate, Przemyslaw Radomski, CFA and his associates do not guarantee the accuracy or thoroughness of the data or information reported. The opinions published above are neither an offer nor a recommendation to purchase or sell any securities. Mr. Radomski is not a Registered Securities Advisor. By reading Przemyslaw Radomski's, CFA reports you fully agree that he will not be held responsible or liable for any decisions you make regarding any information provided in these reports. Investing, trading and speculation in any financial markets may involve high risk of loss. Przemyslaw Radomski, CFA, Sunshine Profits' employees and affiliates as well as members of their families may have a short or long position in any securities, including those mentioned in any of the reports or essays, and may make additional purchases and/or sales of those securities without notice.
Arkadiusz Sieron Archive |
© 2005-2022 http://www.MarketOracle.co.uk - The Market Oracle is a FREE Daily Financial Markets Analysis & Forecasting online publication.