


Technical Analysis Points to DOW 30k Next Target
Stock-Markets / Stock Markets 2018 Nov 19, 2018 - 10:29 AM GMTBy: Chris_Vermeulen

 An incredible really/breakout pattern is setting up in the US Stock Market and US Indexes currently that many traders/investors may not be paying attention to. This is such an incredible opportunity for traders, we are alerting you to this setup and what we expect to be the outcome based on our proprietary predictive price modeling and analysis tools.
Almost without fail, the end of each year experiences a “Christmas Rally” that results in a moderate bullish price bias for most of the 4th quarter. Over the past 17 years, 76.47% of each Q4 period resulted in an average +1049.85 pts in the YM (Dow Futures Contract). Only 23.59% of the time did the YM decline on an average of about -1039.75 pts. This data helps us to understand that downside price rotation in the Q4 (Christmas Rally months) is possible, but unlikely by a 4:1 ratio. It also helps us to understand that our expectations of a massive price rally, much greater than the average +1049 pts, may be a very big play for traders.
We wrote about our predictive modeling system’s expectations on September 17, 2018, https://www.thetechnicaltraders.com/predictive-trading-model-suggests-falling-stock-prices-us-elections/, where we predicted a market top occurring near September 21, followed by a -5~8% price correction, followed by an Ultimate Bottom setup near or after November 8~12. This Ultimate Bottom setup was predicted by our ADL predictive price modeling tool and suggested a bottom in price would prompt a massive upside rally where new market highs will be reached in early 2019 or before. Our Fibonacci price modeling tool is now telling us the breakout move is imminent and we are alerting all our followers to be prepared for some incredible trading opportunities between now and Jan 1, 2019.
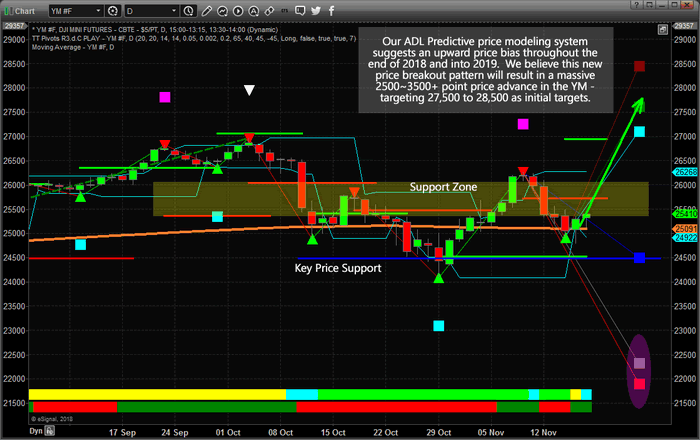
Let’s take a look at some Daily charts that support our conclusions and warn of downside risk levels. Within each of the two following charts, you will notice similarities. The markets are setting up in a similar pattern that clearly illustrates how price wants to react to a positive price impulse and where support is located. We believe any downside risk, at this time, would be from a dramatic external news event. In other words, we believe current support will hold and we believe the upside price bias predicted by our ADL price modeling system will become the ultimate outcome.
This first chart is a Daily YM chart showing our proprietary Fibonacci price modeling system. Notice the upside and downside projected price targets on the right side of the chart. When these price targets are at wide disparities, as they are now, it usually indicates that the markets are setting up for a bigger breakout move. Additionally, it is easy to see the YELLOW Support Zone and the Key Price Support level on this chart. Based on Fibonacci Price Theory, the YM price trend is already Bullish and within a minor price pullback. As long as the Key Price Support level is not breached, the trend will stay Bullish.
Please pay special attention to the upside price targets near 27,500 to 28,500 (nearly 3000 pts higher). We believe the upside price trend predicted by our ADL price modeling system will support a price move up to near these levels before or shortly after Jan 1, 2019. We also believe any downside price risk will be contained with the BLUE Key Price Support level.
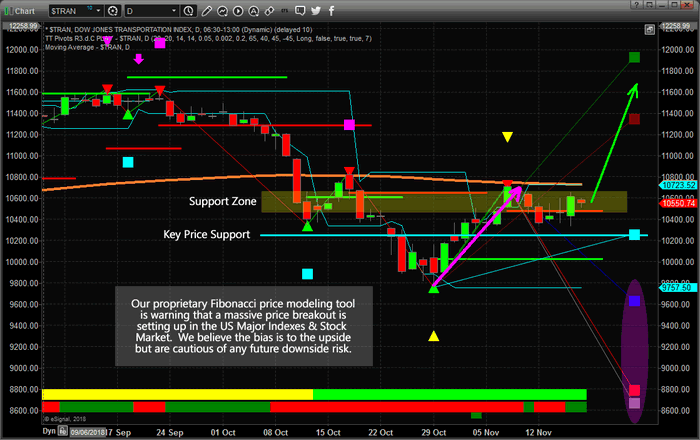
This next Daily chart is of the Transportation Index (TRAN). We are certain you will notice the similarities between the two charts and our Fibonacci Price Modeling System. The primary difference in this chart vs. the YM chart is where the Key Price Support level is located on the price axis of the chart. Overall, the prediction and technical components of these two charts are similar. As long as the Key Price Support level is holding, the upside price bias should drive an upward price breakout over the next few weeks and months.
As traders, we want to understand and identify where opportunities exist, when they become advantageous and when we need to act upon them. Our research team believes the next 5~14 days will present incredible opportunities for skilled traders to identify and setup new trades in certain sectors of the market based on this analysis and our predictions of new price highs within 2+ months.
We’ve seen a similar pattern play out back in March and April of 2018, just before the YM rallied 3400+ pts. If a similar price breakout occurs as we are suggesting, the 30,000 price level in the YM suddenly becomes a very valid price target.
If you like our analysis and research and want to know how we can help you find and execute better trades, please take a minute to visit www.TheTechnicalTraders.com. Our proprietary price modeling tools and our skilled team of traders and researchers attempt to bring you the very best and timely market research you can find. Take a minute to read our September 17th research post to understand just how incredible our research really is. Ask yourself this question, do you know of anyone else that can accurately predict stock market moves 4~6 months in advance? Take a few minutes to learn how we can help you navigate these incredible market opportunities and find new success.
Chris Vermeulen
www.TheTechnicalTraders.com
Chris Vermeulen has been involved in the markets since 1997 and is the founder of Technical Traders Ltd. He is an internationally recognized technical analyst, trader, and is the author of the book: 7 Steps to Win With Logic
Through years of research, trading and helping individual traders around the world. He learned that many traders have great trading ideas, but they lack one thing, they struggle to execute trades in a systematic way for consistent results. Chris helps educate traders with a three-hour video course that can change your trading results for the better.
His mission is to help his clients boost their trading performance while reducing market exposure and portfolio volatility.
He is a regular speaker on HoweStreet.com, and the FinancialSurvivorNetwork radio shows. Chris was also featured on the cover of AmalgaTrader Magazine, and contributes articles to several leading financial hubs like MarketOracle.co.uk
Disclaimer: Nothing in this report should be construed as a solicitation to buy or sell any securities mentioned. Technical Traders Ltd., its owners and the author of this report are not registered broker-dealers or financial advisors. Before investing in any securities, you should consult with your financial advisor and a registered broker-dealer. Never make an investment based solely on what you read in an online or printed report, including this report, especially if the investment involves a small, thinly-traded company that isn’t well known. Technical Traders Ltd. and the author of this report has been paid by Cardiff Energy Corp. In addition, the author owns shares of Cardiff Energy Corp. and would also benefit from volume and price appreciation of its stock. The information provided here within should not be construed as a financial analysis but rather as an advertisement. The author’s views and opinions regarding the companies featured in reports are his own views and are based on information that he has researched independently and has received, which the author assumes to be reliable. Technical Traders Ltd. and the author of this report do not guarantee the accuracy, completeness, or usefulness of any content of this report, nor its fitness for any particular purpose. Lastly, the author does not guarantee that any of the companies mentioned in the reports will perform as expected, and any comparisons made to other companies may not be valid or come into effect.
Chris Vermeulen Archive |
© 2005-2022 http://www.MarketOracle.co.uk - The Market Oracle is a FREE Daily Financial Markets Analysis & Forecasting online publication.