


Most Stock Market’s Around the World are Falling. What’s Next?
Stock-Markets / Stock Markets 2018 Nov 26, 2018 - 11:24 AM GMTBy: Troy_Bombardia

The U.S. stock market has made a 61.8% bounce and now retested its lows, which is the standard pattern for these fast 10%+ corrections. “Drop, pop, and slop”
Now that the stock market has almost retested its exact October 2018 lows, what’s next?
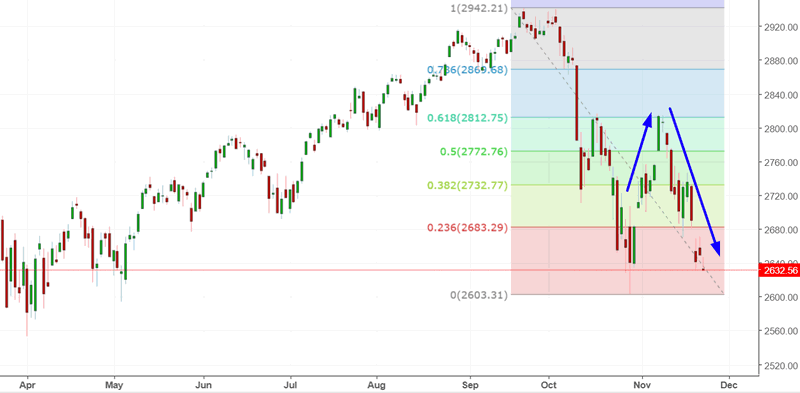
Source: Investing.com
The economy’s fundamentals determine the stock market’s medium-long term outlook. Technicals determine the stock market’s short-medium term outlook. Here’s why:
- The stock market’s long term is bullish, but this will change in 2019.
- The stock market’s medium term is bullish (i.e. next 6-9 months).
- The stock market’s short term is mostly a 50-50 bet.
*At this point in the late-cycle bull market, the medium term & long term have become one and the same.
We focus on the medium and long term. Let’s go from the long term, to the medium term, to the short term.
Long Term
Our long term outlook remains bullish. This bull market will probably last until Q2 2019, after which a bear market will ensue. (This date is a moving target and will be adjusted as new data becomes available).
The economy and the stock market move in the same direction in the long term. Hence, leading economic indicators are also long term leading stock market indicators.
Leading indicators are starting to show some signs of deterioration, but not enough for the bull market to peak. The usual chain of events looks like this:
- Housing – the earliest leading indicators – starts to deteriorate. Meanwhile, the U.S. stock market is still in a bull market while the rest of the U.S. economy improves. The rally gets choppy, with volatile corrections along the way. We are here right now
- The labor market starts to deteriorate. Meanwhile, the U.S. stock market is still in a bull market. This will likely happen in Q1 2019.
- The labor market deteriorates some more, while other economic indicators start to deteriorate. The stock market tops, and the bull market is over.
Let’s look at the data.
For starters, the housing sector is slowing down. Housing Starts is trending sideways, Building Permits are trending downwards (Permits lead Housing Starts), and homebuilder sentiment is weakening.
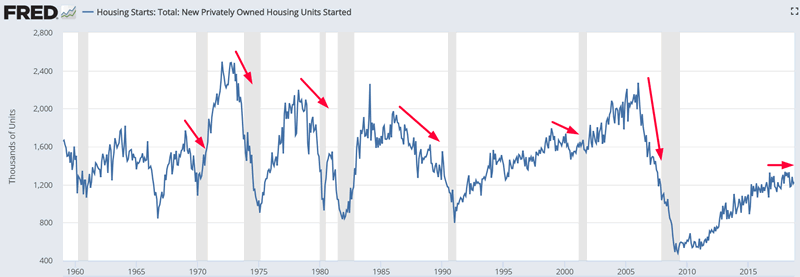
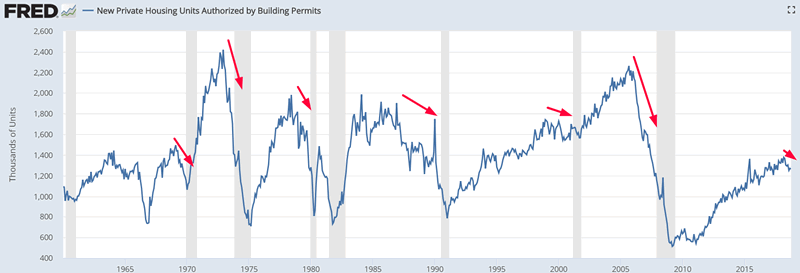
Source: FRED
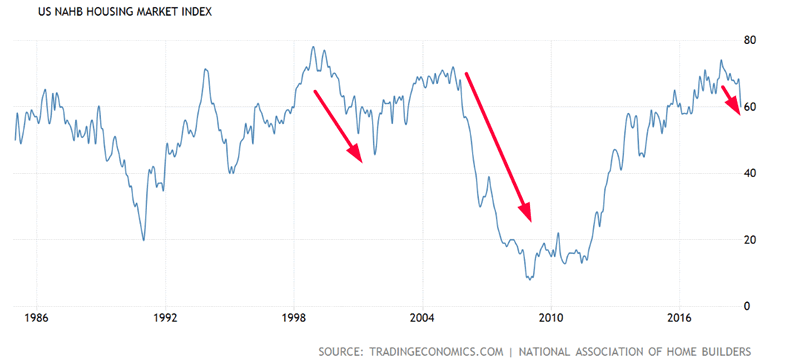
Source: TradingEconomics
Continued Claims is still trending downwards, but Initial Claims are trending sideways. These 2 data series will probably start to trend upwards in 2019, which makes this a long term bearish factor for the stock market in 2019.
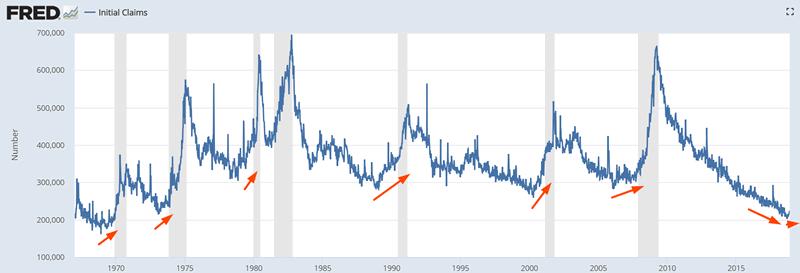
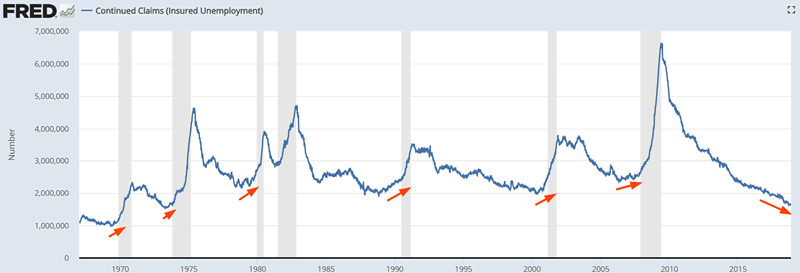
Source: FRED
But is the bull market over? Probably not. The Conference Board’s Leading Economic Index continues to make new highs.
The Conference Board’s Leading Economic Index continues to trend higher. Historically, this was a long term bullish sign for the stock market. The Leading Economic Index trended lower before bear markets and recessions started.
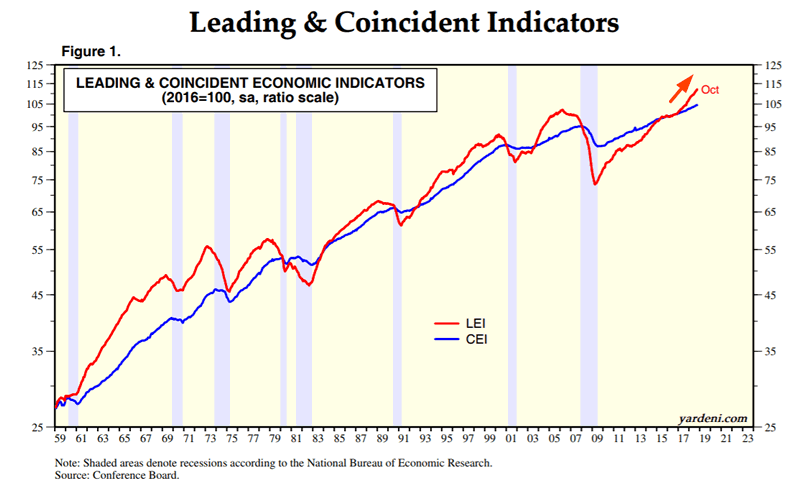
Source: Ed Yardeni
Like the Conference Board’s Leading Economic Index, corporate profits continues to trend higher. In the past, inflation-adjusted corporate profits trended lower or sideways before bull markets ended.
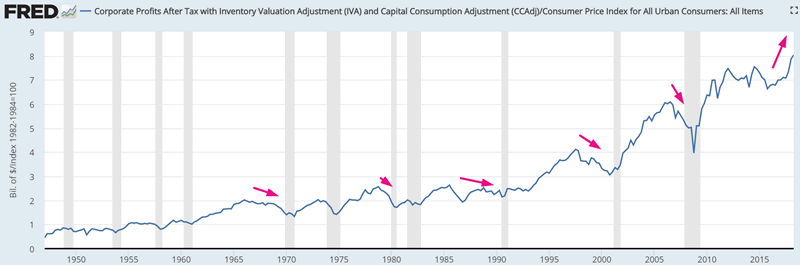
Source: FRED
Medium Term
Our medium term outlook (next 6-9 months) remains bullish.
*For reference, here’s the random probability of the U.S. stock market going up on any given day, week, or month.

This week was a shortened week with low volume.
Year-to-date, almost all asset classes have been down around the world (stocks, commodities, bonds, real estate). The U.S. stock market is hovering around flat when adjusted for dividends (and slightly negative ex-dividends).
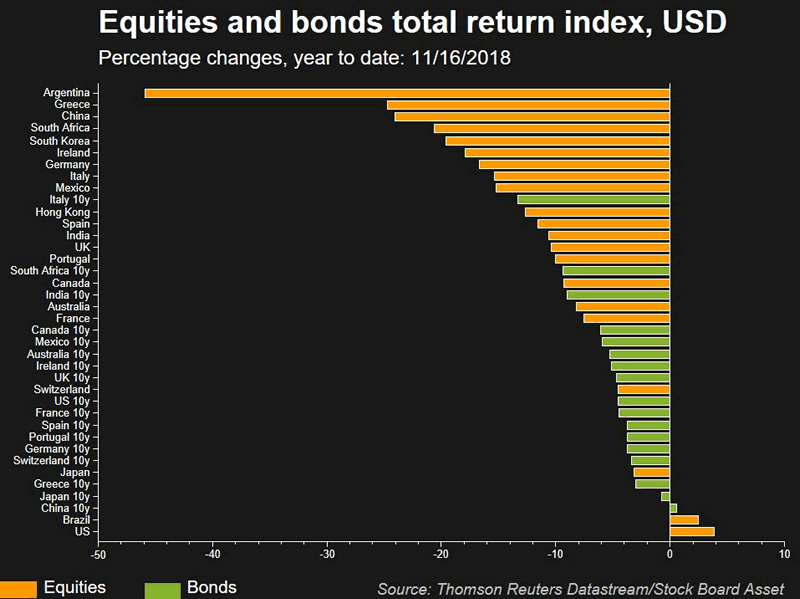
Source: Bloomberg
The following chart from Bloomberg demonstrates that this is the 3rd time in the past 100 years in which more than 60% of global assets have fallen.
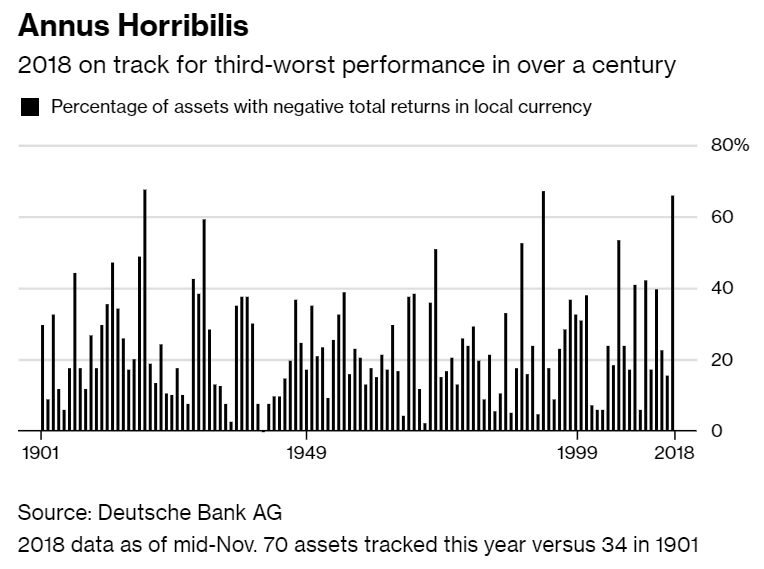
Source: Bloomberg
The 3 years are:
- 2018
- 1994
- 1920
How did the U.S. stock market do in the other 2 following years? (1921 and 1995)?
Here’s the Dow Jones Industrial Average in 1921 and 1995
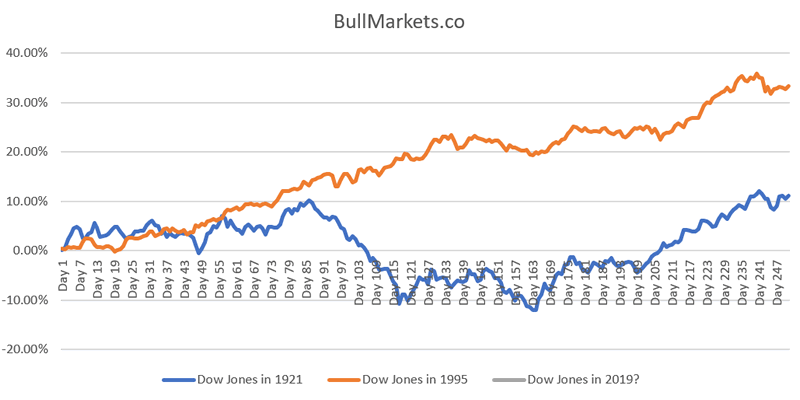
As you can see, the stock market went up in both of those cases. Is this a long term bullish factor for the U.S. stock market in 2019? I don’t think so. I think this is a mostly irrelevant factor: neither bullish nor bearish.
- N = 2
- Morever, you shouldn’t use other assets (eg real estate, bonds, commodities) to predict the stock market. That’s an apples vs. oranges comparison.
One of the worst assets recently has been oil. Oil has fallen significantly over the past 2 months.
Oil is now down 7 weeks in a row.
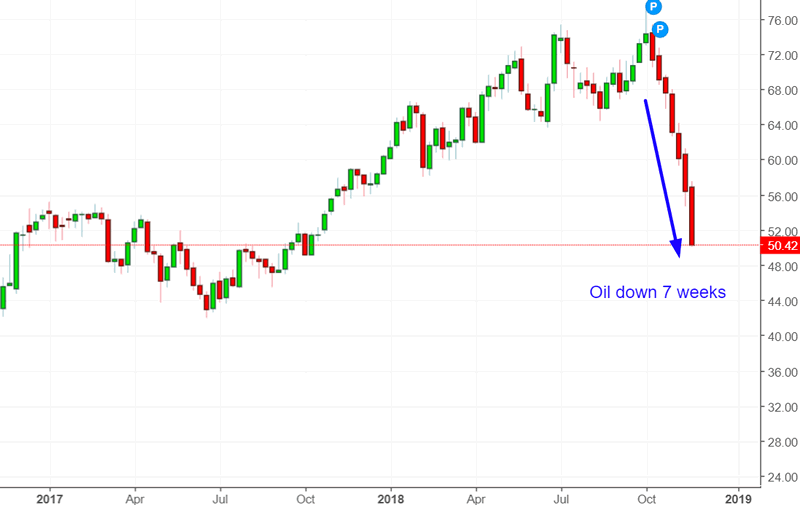
Source: Investing.com
Here’s what happens next to oil when it falls 7 weeks in a row.
*Data from 1983 – present
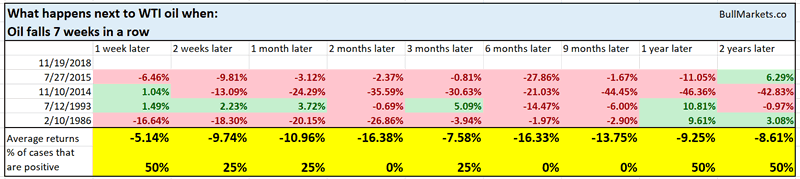
As you can ese, oil’s forward returns aren’t good. There will be a bounce along the way, but this is generally not a long term bullish sign for oil.
Here’s what happens next to the S&P 500 when oil falls 7 weeks in a row.
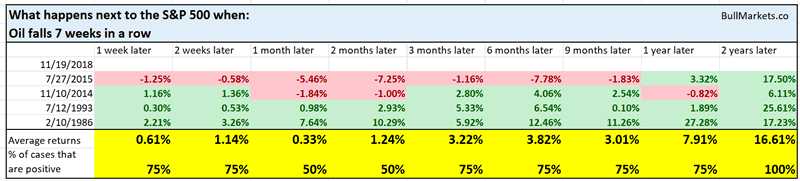
As you can see, the stock market doesn’t usually go down. This isn’t consistently bearish for the stock market.
Here’s another way to look at oil’s recent drop. Oil has had several big down days. Over the past 2 weeks, 3 days have seen oil fall 6% or more.
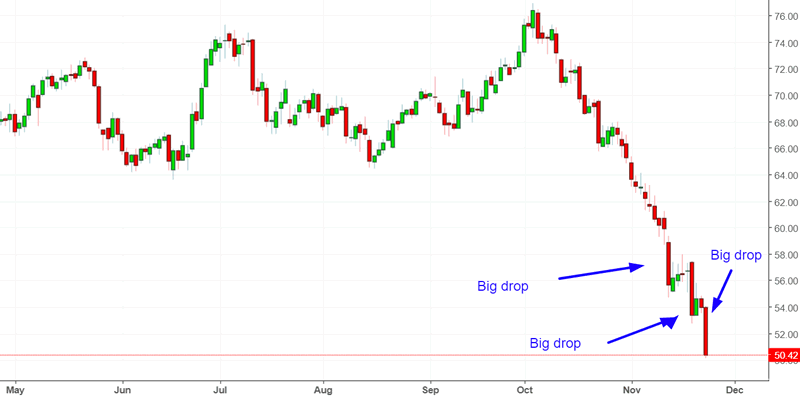
Source: Investing.com
Here’s what happens next to the S&P 500 when oil has 3 or more greater than -6% daily drops in the past 2 weeks.
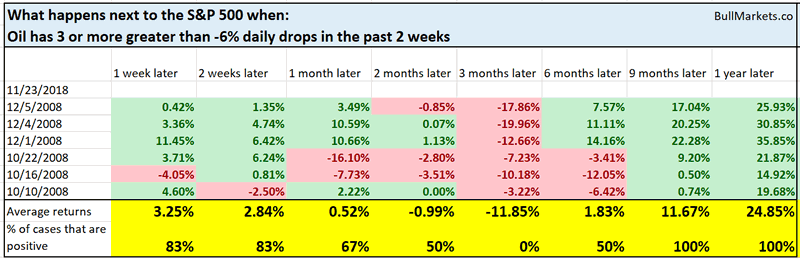
As you can see, all of these cases occurred in 2008, after the stock market fell 40%.
Here’s what happens next to oil when it has 3 or more greater than -6% daily drops in the past 2 weeks.
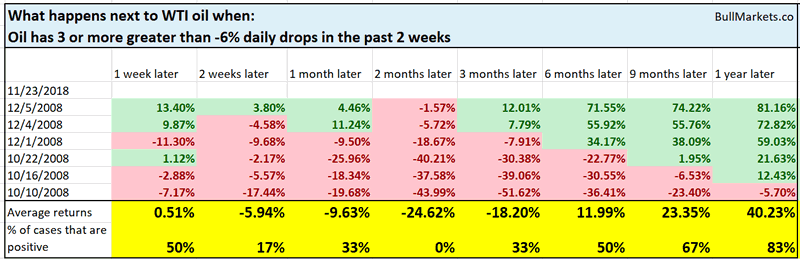
And here’s one final way of looking at oil.
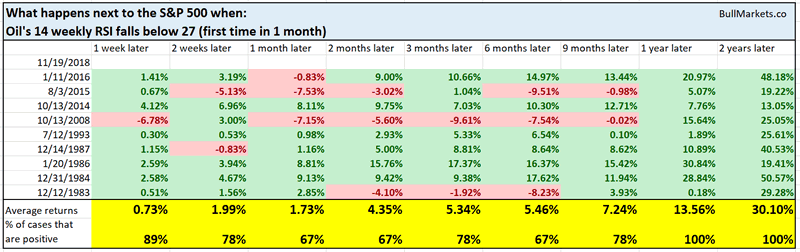
Here’s what happens next to the S&P when oil’s 14 weekly RSI falls below 27 (i.e. oversold).
Here’s what happens next to the oil when its 14 weekly RSI falls below 27 (i.e. oversold).
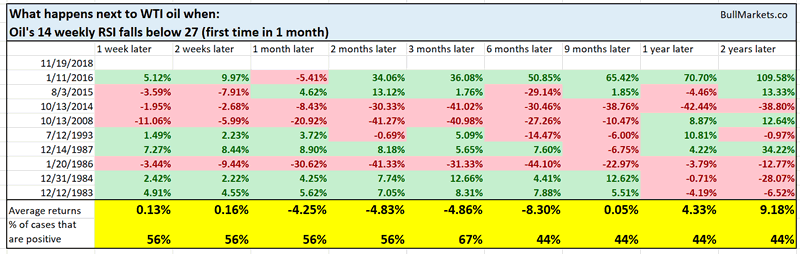
So the conclusion is clear: an oversold oil isn’t necessarily medium term or long term bullish for oil itself, but it is not a “contagion risk” for the U.S. stock market.
Sentiment has fallen along with the U.S. stock market. The AAII Bullish % is now at 25%.
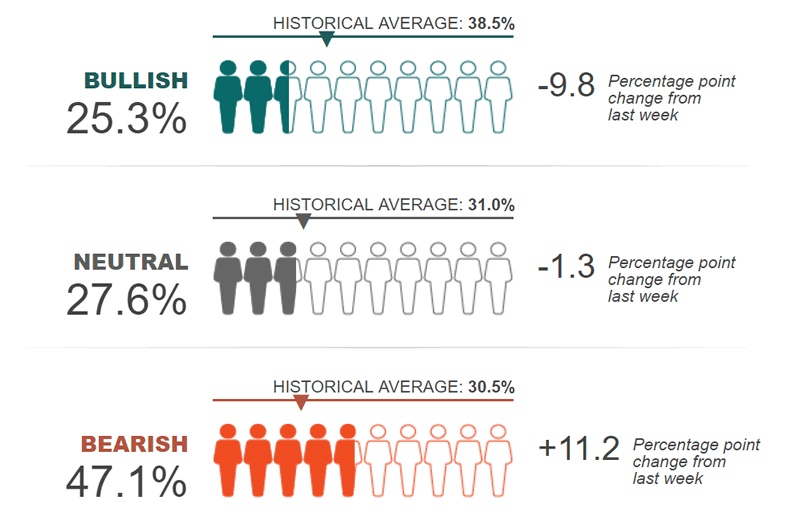
Source: AAII
Here’s what happens next to the S&P 500 when AAII Bullish % falls below 26%
*Data from 1987 – present
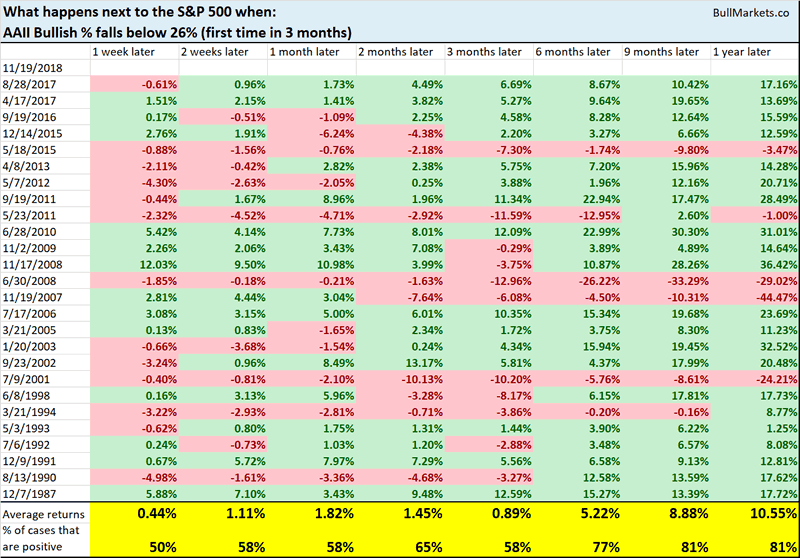
As you can see, this doesn’t mean much for the stock market in the short term, although it is a slightly bullish factor for the stock market over the next 9-12 months.
Volatility in the U.S. stock market remains heightened. As of Tuesday, 7 of the last 30 trading days have seen the stock market fall -1.5% or more.
Here’s what happens next to the S&P when at least 7 of the past 30 trading days have seen the stock market fall -1.5% or more.
*Data from 1928 – present
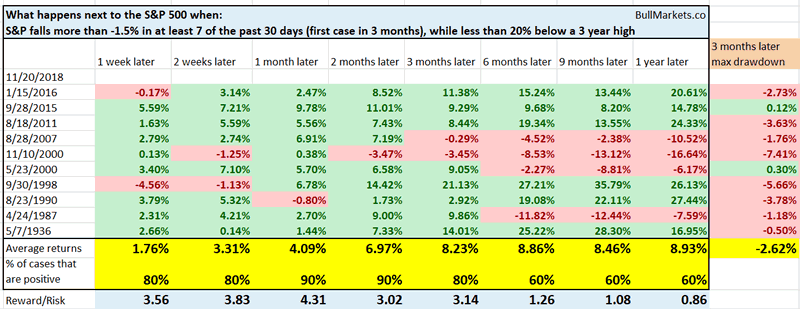
As you can see, the stock market’s forward returns are bullish 2-3 months later.
XLY is the Consumer Discretionary ETF and XLP is the Consumer Staples ETF. The XLY:XLP ratio tends to fall when the stock market falls because consumer discretionary (an aggressive sector) underperforms consumer staples (a defensive sector, like utilities).
As of Tuesday, this ratio has fallen quite a lot recently along with the stock market’s decline. As a result, the ratio’s weekly RSI is quite low.
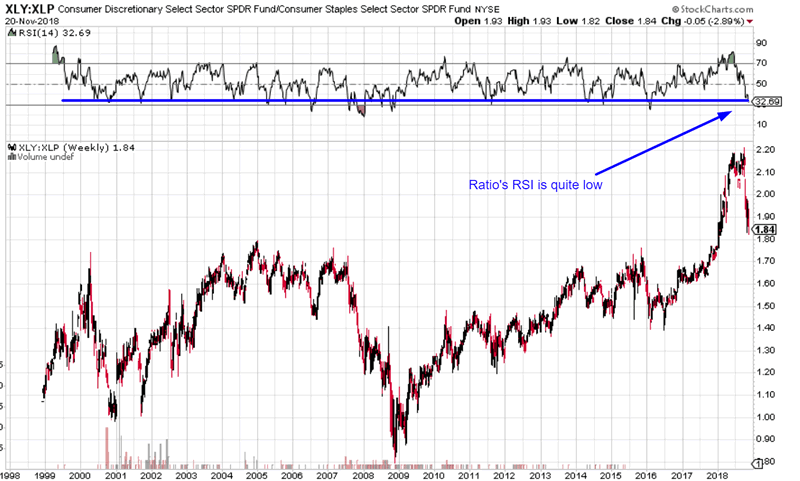
Source: StockCharts
Here’s what happened next to the S&P 500 when the XLY:XLP ratio’s 14 weekly RSI fell below 33.
*Data from 1999 – present.
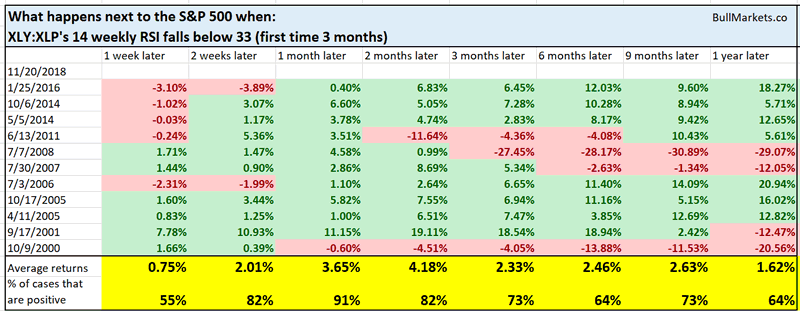
As you can see, the stock market does well over the next 1-2 months.
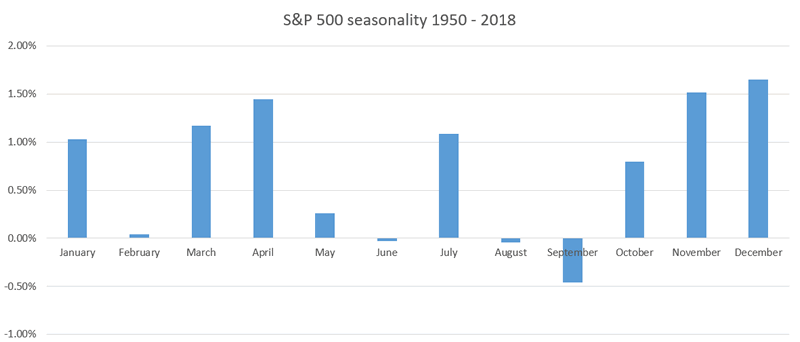
And lastly, remember that December is the stock market’s most bullish month, from a seasonality perspective. Seasonality factors are of secondary importance because they aren’t consistent. The stock market’s seasonality can break down at any point in time because there is no solid fundamental reason underpinning most of these patterns.
Short term
The stock market’s short term is mostly a 50-50 bet right now, as it is most of the time.
We don’t focus on the short term, because no one can consistently and accurately predict it. When was the last time you saw the world’s greatest investors and fund managers focus on all the short term swings? If reading the tea leaves worked, these billionaires would hire an army of chart “technicians” to do that.
Click here to read last week’s discretionary market outlook.
Conclusion
Here is our discretionary market outlook:
- The stock market’s long term is bullish. The bull market will probably peak in Q2 2019, after which a bear market will ensue.
- The stock market’s medium term is bullish (i.e. trend for the next 6-9 months).
- The stock market’s short term is mostly a 50-50 bet right now.
Focus on the medium term and the long term.
Our discretionary outlook is not always a reflection of how we’re trading the markets right now. We trade based on our clear, quantitative trading models, such as the Medium-Long Term Model.
Members can see exactly how we’re trading the U.S. stock market right now based on our trading models.
Click here for more market studies.
By Troy Bombardia
I’m Troy Bombardia, the author behind BullMarkets.co. I used to run a hedge fund, but closed it due to a major health scare. I am now enjoying life and simply investing/trading my own account. I focus on long term performance and ignore short term performance.
Copyright 2018 © Troy Bombardia - All Rights Reserved
Disclaimer: The above is a matter of opinion provided for general information purposes only and is not intended as investment advice. Information and analysis above are derived from sources and utilising methods believed to be reliable, but we cannot accept responsibility for any losses you may incur as a result of this analysis. Individuals should consult with their personal financial advisors.
© 2005-2022 http://www.MarketOracle.co.uk - The Market Oracle is a FREE Daily Financial Markets Analysis & Forecasting online publication.