Stock Market Approach Neckline
Stock-Markets / Financial Markets 2018 Nov 26, 2018 - 02:20 PM GMTVIX advanced during the short holiday week, making a new high and higher low, closing above its weekly Cycle Top at 20.63. Note the Head & Shoulders formation which may give it more impetus in the next week. VIX is also positioned for a triply-indicated surge of strength through mid-December.
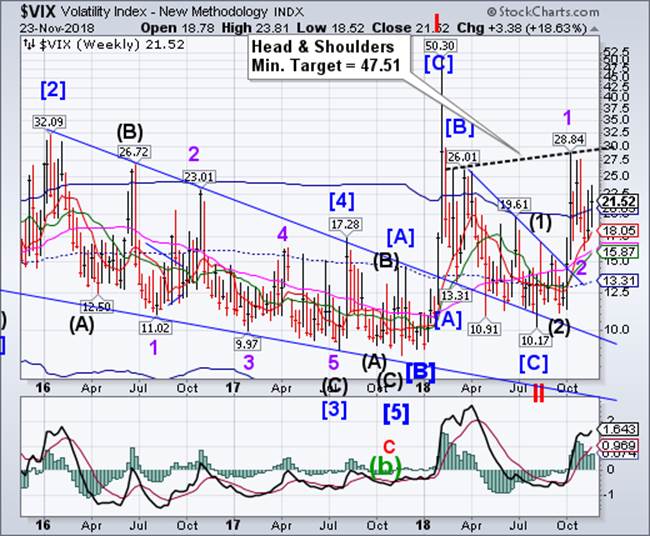
(Bloomberg) An aggressive implied volatility storm has not developed amid the recent declines in global stock market indexes.
The relationship between S&P 500 and VIX has flattened, leaving put spreads on the index outperforming volatility call options. SPX realized volatility remains historically elevated (10-day at the 80th-percentile of the 5-year range) but there’s no sign of extreme downside hedging panic on short-dated skews.
SPX approaching the neckline.
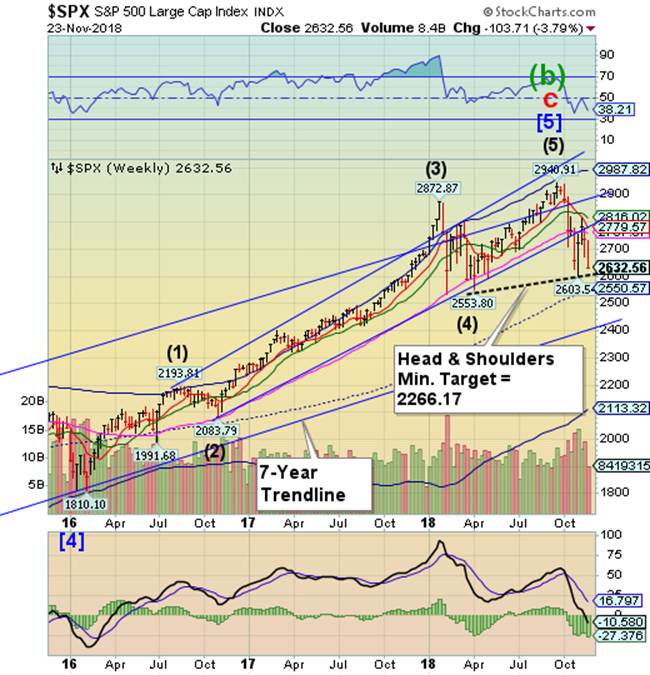
SPX resumed its decline during the shortened holiday week, nearing the neckline of a proposed Head & Shoulders formation that promises further declines. The Cycles Model now implies a week-long decline that may test its weekly Cycle Bottom at 2113.32.
(Bloomberg) The nasty sell-off in equity markets has raised doubts about the Federal Reserve’s willingness to follow through with its plan to boost interest rates again in December. It shouldn’t.
The odds that market participants place on a rate hike had dropped to around 65 percent from a high of more than 80 percent a few weeks ago. The decline comes even as central bankers give little reason to doubt that another rate hike is coming. New York Federal Reserve President John Williams, a permanent voting member on the Federal Open Markets Committee, reiterated this week his expectation that the Fed would “be likely raising interest rates somewhat but it’s really in the context of a very strong economy.”
NDX breaks through the neckline.
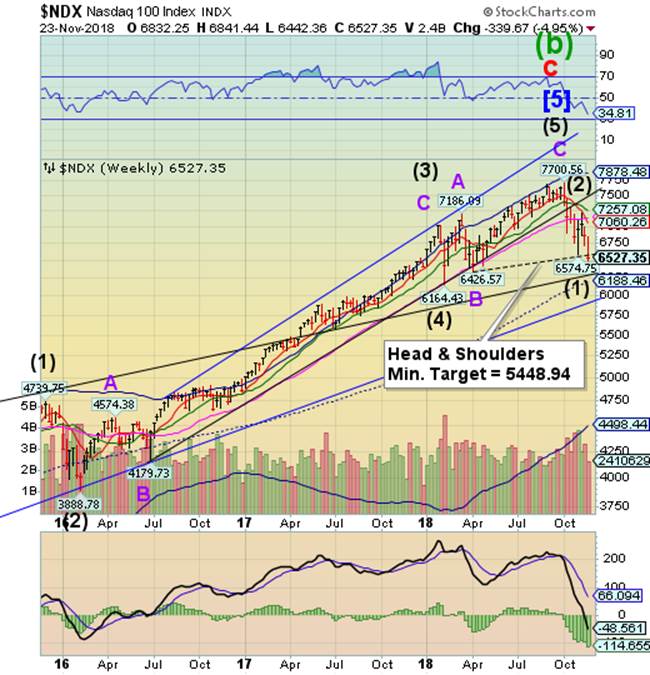
NDX managed to break through its Head & Shoulders neckline at 6600.00, potentially triggering that formation. The Cycles Model suggests the sell signal may be intensified in the next week. Margin calls may resume beneath the neckline as leveraged positions appear to be threatened.
(ZeroHedge) It gets serious. Margin calls?
No one knows what the total leverage in the stock market is. But we know it’s huge and has surged in past years, based on the limited data we have, and from reports by various brokers about their “securities-based loans” (SBLs), and from individual fiascos when, for example, a $1.6 billion SBL to just one guy blows up. There are many ways to use leverage to fund stock holdings, including credit card loans, HELOCs, loans at the institutional level, loans by companies to its executives to buy the company’s shares, or the super-hot category of SBLs, where brokers lend to their clients. None of them are reported on an overall basis.
High Yield Bond Index breaks the trendline again.
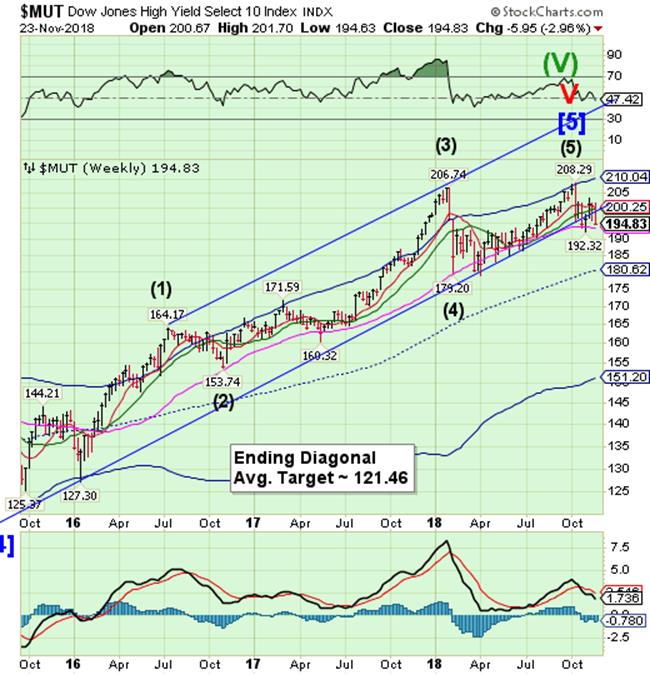
The High Yield Bond Index broke through its long-term trendline and appears to be challenging its Long-term support at 193.49. It is on a sell signal. High yield bonds are also anticipating further weakness through the end of the November and possibly extending into mid-December.
(Investing) U.S. fund investors renewed their concerns about credit quality in corporate debt markets during the latest week, hitting leveraged loan and high-yield debt funds with multibillion-dollar withdrawals, Lipper data showed on Friday.
So-called "loan participation funds," made up of funds that buy loans to highly indebted companies that typically must pay investors more as interest rates rise, posted $1.7 billion in withdrawals during the week ended Nov. 21. That was the most cash pulled from those funds since December 2015, the research service's data showed.
High-yield "junk" bond funds based in the United States recorded $2.2 billion in withdrawals, the most in four weeks. Those funds include bonds from issuers with lower credit ratings.
UST maintains Intermediate-term support.
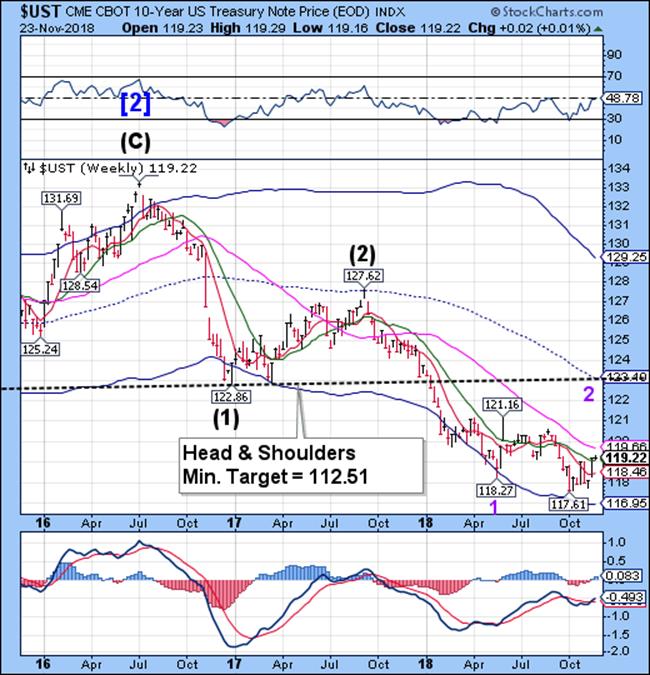
The 10-year Treasury Note Index managed to remain above Intermediate-term support at 119.09 this week, maintaining its buy signal. UST may extend its rally into December according to the Cycles Model.
(MarketWatch) Treasury yields fell Friday, following the drop in European debt yields, after a round of tepid economic data appeared to furnish new obstacles to the European Central Bank’s plans to normalize monetary policy.
The 10-year Treasury note yield TMUBMUSD10Y, +0.00% gave up 1.6 basis points to 3.045%, its lowest since Sep. 17, extending the weeklong decline to 2.9 basis points, according to Dow Jones Market Data. The 2-year note yield TMUBMUSD02Y, +0.00% was mostly unchanged at 2.814%, leaving it virtually flat for the week. The 30-year bond yieldTMUBMUSD30Y, +0.00% fell 0.5 basis point to 3.306%, adding to a weeklong decline of 2.1 basis points. Bond prices move in the opposite direction of yields.
The Euro repelled at mid-Cycle resistance.
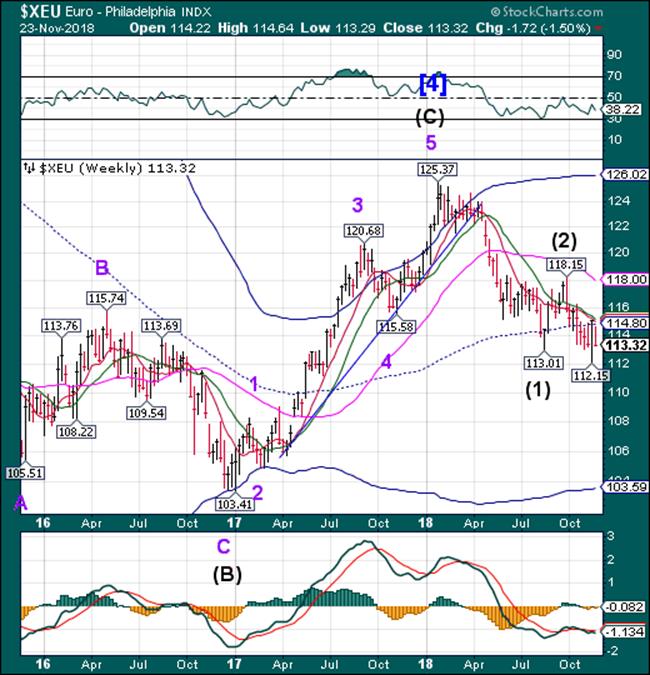
The Euro was repelled at mid-Cycle resistance at 114.80. It may retest resistance again this week in an attempt at a new retracement high. The bounce, has the potential of lasting through the end of November.
(Bloomberg) Betting on a stronger euro may have a limited shelf life as its long term prospects remain bearish.
Any move higher in the common currency may meet selling pressure as soft euro-zone data and the ongoing rift between Italy and the European Commission cancel out bets on fewer Federal Reserve interest-rate hikes. Bears could take advantage of a rally toward $1.15 resistance to add to existing positions, while bulls may need to cut exposure if the currency slips toward $1.13.
Trade-positive headlines out of the highly anticipated meeting between U.S. President Donald Trump and Chinese leader Xi Jinping at the Group of 20 summit in Argentina this week may weigh on risk-off trades and force another round of a euro short squeeze. The Fed minutes of its Nov. 7-8 meeting and any dovish signs could further boost bets on a slower pace of tightening than currently priced in.
EuroStoxx is heading for the Cycle Bottom.
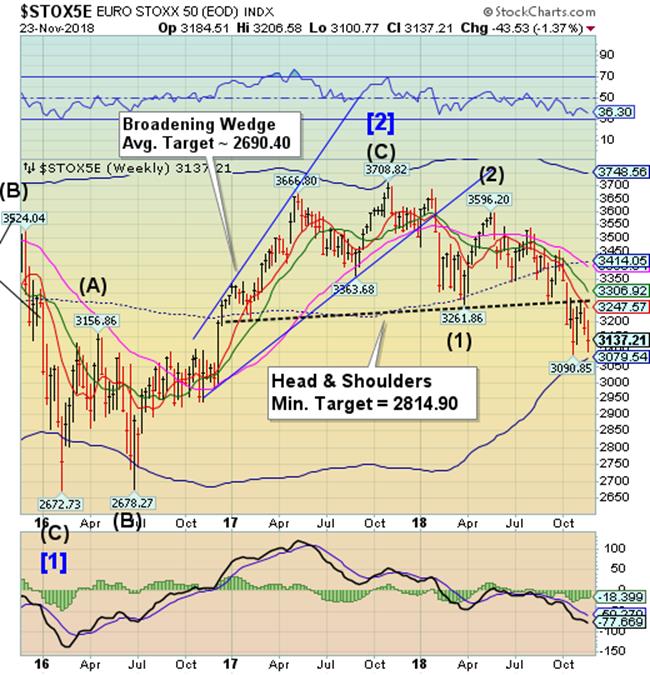
The EuroStoxx declined toward its Cycle Bottom support at 3079.54. Unfortunately, that support may not hold as EuroStoxx is due for a significant, lower low by mid-December.
(Investing) European stock markets rose on Friday after a volatile week in which company earnings and growth worries hit stocks, although the euro sank after weaker-than-expected business surveys from Germany and the euro zone.
Italian stocks .FTMIB led the bounce in equities, rallying hard after the country's bond yields fell after a press report that EU Affairs Minister Paolo Savona is considering resigning over the government's decision to challenge European Union budget rules. GVD/EUR
The pan-European STOXX 600 .STOXX index was up 0.1 percent. Europe's performance on Friday stood in contrast to Asia, where steep losses in Chinese markets hit stocks amid lingering trade war tensions and worries about global growth. .EU
.The Yen is barely hanging on to support.
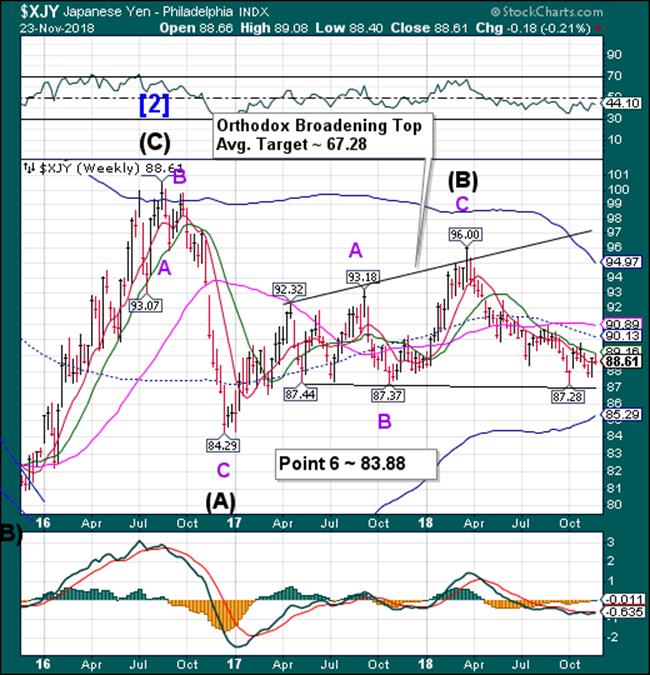
The Yen tested Intermediate-term resistance at 89.16 before challenging Short-term support at 8815, barely closing above it. The potential rally fizzled, leaving the yen in a weakened condition lasting the next two weeks. A new three-year low may be possible.
(DailyFX) WHAT IS THE JAPANESE YEN?
The Yen (JPY), meaning “round object”, is the official currency of Japan. It was established by the Meji government in 1871 as part of the state’s modernization program. The idea was to shed Japan’s multi-currency regime that was maintained by feudal fiefs and instead mimic their European counterparts, implementing a uniform currency throughout the entire country.
History of the Bank of Japan: Monetary Policy & Yen Deflation
The Bank of Japan (BOJ) is the country’s central bank. Established in 1882, it was given a monopoly on controlling the money supply as a way to prevent other parties from minting yen. Starting in the 1990s, Japan’s currency began to experience what BOJ Governor Haruhiko Kuroda described as a “chronic disease” of deflation.
Nikkei rejected at the trendline again, resumes the decline.
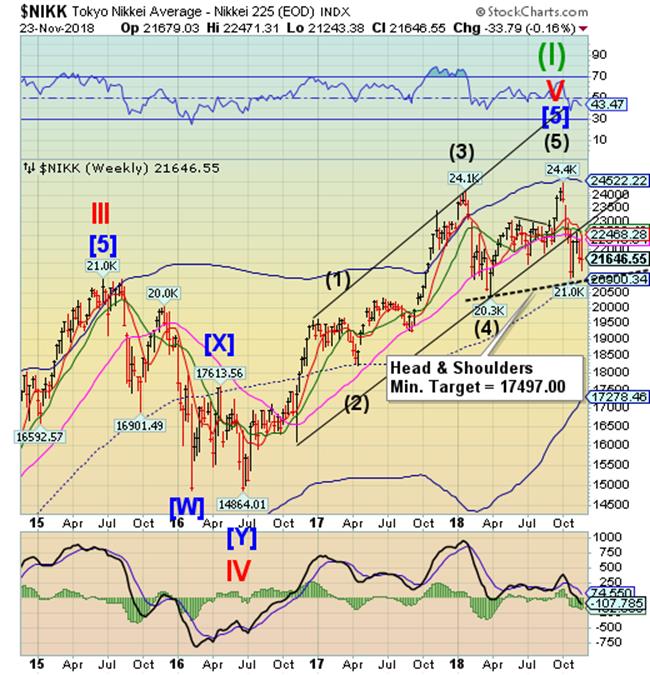
The Nikkei rallied toward the trendline and Short-term resistance at 22468.28, but was rejected. The decline appears to have resumed and the sell signal is back in place. The Cycles Model suggests that the decline may last into early December with the weekly Cycle Bottom as a potential target.
(Investing) Japan's Nikkei rose on Thursday in choppy trade with gains for defensive stocks and companies linked to inbound tourism demand after data showed a bounce in visitors in October.
The Nikkei .N225 gained 0.7 percent to 21,646.55, yet it barely moved for the week. The broader Topix .TOPX advanced 0.8 percent to 1,628.96, though trade was thin, with only 1.2 billion shares changing hands, the lowest figure in a month.
Japanese markets will be closed on Friday due to a national holiday, with investors looking to the outcome of Black Friday sales that follow Thursday's U.S. Thanksgiving Day holiday, at a time when wages are rising and consumer confidence is high in the United States.
U.S. Dollar bounces from Short-erm support.
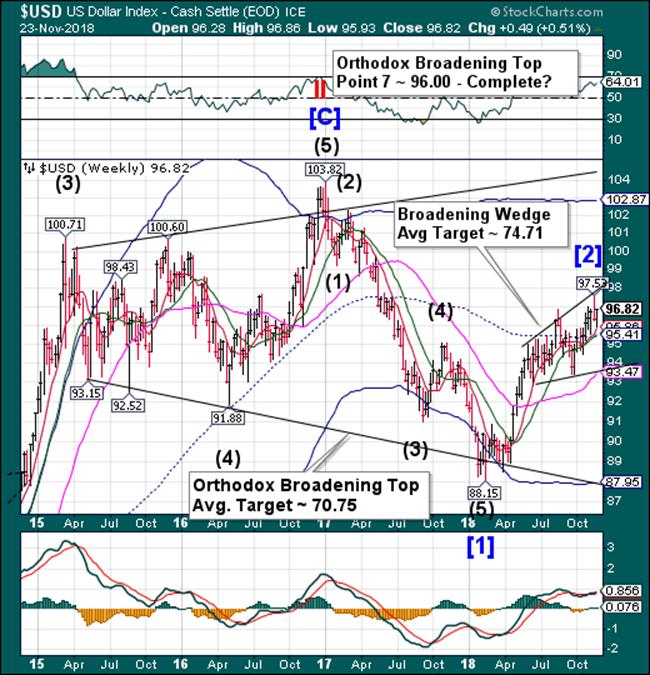
USD extended its decline to Short-term support at 95.98, where it bounced. The Cycles Model calls for a resumption of the decline for the next 2-3 weeks. The new Broadening Wedge may be triggered as it declines beneath the lower trendline at 87.95.
(Investing) Dollar Higher as Trade War Concerns Fuel Risk Aversion
The dollar is higher on Friday against most major pairs. The greenback gained the most against the EUR as disappointing PMI surveys and the uncertain future of the Brexit deal ahead of the weekend took its toll on the single currency. Oil prices tumbled as fears of oversupply put losses at more than 11 percent despite the best efforts of the Organization of the Petroleum Exporting Countries (OPEC) to once again stop the decline with a probable production cut agreement. Global growth concerns are reducing expectations of energy demand with the trade war between the US and China a growing concern ahead of the G20 meeting in Argentina later this month.
.Gold consolidates above support support.
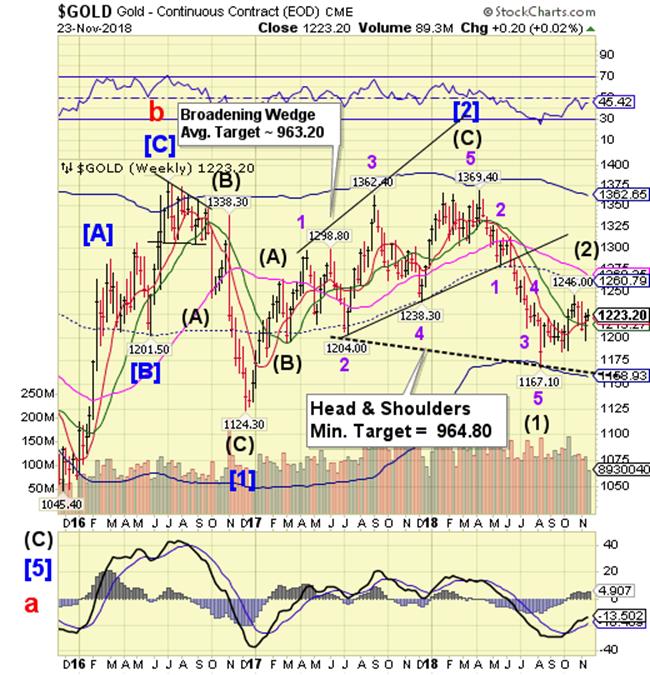
Gold consolidated above Short-term support at 1219.60, keeping the short-term uptrend intact. The Model calls for strength over the next two weeks. A potential retracement target may be the mid-Cycle resistance at 1260.79. Gold may be extending the right shoulder of a potential Head & Shoulders formation before resuming its downtrend.
(Reuters) - Gold prices were steady in holiday-thin trade on Thursday after hitting a two-week peak in the previous session, with improved risk appetite weighing on the U.S. dollar.
Spot gold XAU= was 0.1 percent higher at $1,227.25 per ounce at 0742 GMT. Prices on Wednesday marked their strongest since Nov. 7 at $1,230.07 per ounce.
U.S. gold futures GCcv1 were flat at $1,227.6 per ounce.
"The market is a bit slow today with low volume due to the Thanksgiving holiday... The dollar is slightly on the downside, giving some support to gold," said Peter Fung, head of dealing at Wing Fung Precious Metals in Hong Kong.
Crude crashes nearly 35% from its high.
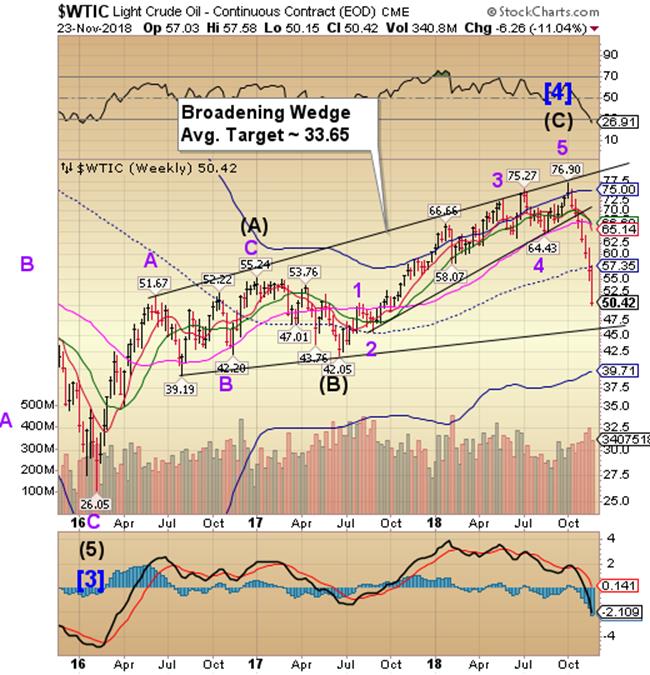
Crude may finally have reached a bottom after crashing 34.8% from its high. It has met both Cycles time and price objectives and may be ready for a bounce. There is no signal yet, but prudence dictates taking downside profits.
(MarketWatch) U.S. oil on Friday registered the worst day in about three years, with the contract also notching a seventh straight weekly fall, as investors increasingly focused on supply worries ahead of an important OPEC gathering.
January West Texas Intermediate crude CLF9, -7.76% slid $4.21, or 7.7%, to settle at $50.42 a barrel, representing the worst day since July 6 of 2015 and the lowest settlement since Oct. 9, 2017, according to Dow Jones Market Data. Futures also booked a seventh straight weekly drop, tumbling 10.6% during the week, based on last Friday’s settlement.
Global benchmark January Brent LCOF9, -5.45% slid $3.80, or 6.1%, to $58.80 a barrel. Brent shed nearly 12% during the week.
The crude complex closed an hour early on Friday at 1:30 Eastern Time.
Shanghai Index makes a new three week low.
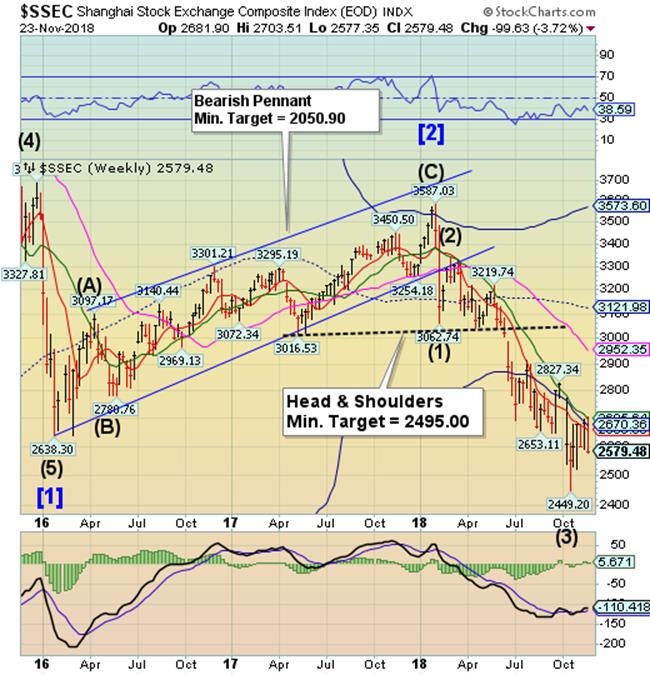
The Shanghai Index challenged Intermediate-term resistance at 2695.64, but was repulsed to a new three-week low. Now the challenge is to find support near 2500.00 for another attempt at overhead resistance. Should it fail, the decline resumes through the year-end and a potential bottom near 2000.00.
(NewsTimes) The Shanghai Composite, China's benchmark share index, dropped just shy of 2.5% of its value on the day, driven by investor jitters about the trade war ahead of next week's G20 meeting in Buenos Aires, Argentina.
During that event, President Donald Trump and Chinese President Xi Jinping are set to hold a bilateral meeting to discuss trade between the two countries.
Investors are worried that the meeting will be fruitless and allow the continued imposition of tariffs on more than $300 billion of goods flowing between the two countries.
The Banking Index closes beneath mid-Cycle support.
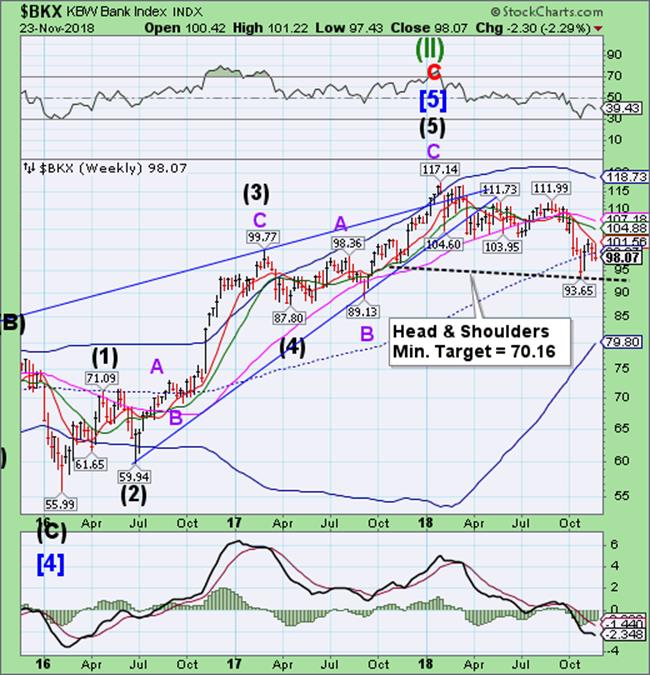
-- BKX consolidated in a weekly inside fluctuation that closed beneath mid-Cycle support at 99.27. This leaves the Banking Index in a weakened position, so a resumption of the decline may break through the neckline of the Head & Shoulders formation at 93.00, causing a panic decline. The Cycles Model calls for a significant low by mid-December which may meet the implied Head & Shoulders target.
(Bloomberg) Banks with their European Union headquarters in London are getting on with ensuring they can operate in the bloc after Britain leaves.
Twenty-five banks have concluded, or are close to finishing, applications for EU subsidiaries, said Daniele Nouy, the industry’s chief supervisor at the European Central Bank. The number rises to 37 when you include investment firms which are related to banks but don’t fall under the ECB’s responsibility, she said.
(SeekingAlpha) Eurozone banks have fallen dramatically in the stock market despite the results of the stress tests carried out by the European Central Bank, and the EU Banks Index is down 25 percent on the year despite year-long bullish recommendations from almost every broker. This should not surprise anyone because we have seen in the past that these tests are only a theoretical exercise.
Moreover, stress tests' results are widely challenged, and rightly so, because the exercise starts with the most ridiculous premise in economics: Ceteris Paribus, or "all else remaining equal," which never happens. Every asset manager knows that risk builds slowly and happens fast.
Disappointing earnings, rising risk in the eurozone as well as in their diversification markets such as emerging economies, weak net income margins and low return on tangible equity are factors that have contributed to the weak performance of European banks. Investors are rightly suspicious about consensus estimates for 2019 with expectations of double-digit earnings-per-share growth rates. Those growth rates look impossible in the current macroeconomic environment.
(Bloomberg) When it comes to U.S. banks’ lending risk, it doesn’t get much bigger than General Electric Co. The five biggest Wall Street firms have committed to lending at least $3.5 billion each to the industrial giant facing concerns about the sustainability of its debt.
GE has almost $41 billion in credit lines it can draw from, according to its latest quarterly regulatory filing. If fully tapped, the two main credit facilities would rank as the largest loans to any U.S. company that go beyond next year, data compiled by Bloomberg show. GE had used only about $2 billion of the available credit by the end of the third quarter, leaving itself ample room to pull more if necessary.
Regards,
Tony
Our Investment Advisor Registration is on the Web.
We are in the process of updating our website at http://mrpracticalinvestor.com/ to have more information on our services. Log on and click on Advisor Registration to get more details.
If you are a client or wish to become one, please make an appointment to discuss our investment strategies by calling Connie or Tony at (517) 699-1554, ext 10 or 11. Or e-mail us at tpi@thepracticalinve4stor.com .
Anthony M. Cherniawski, President and CIOhttp://mrpracticalinvestor.com
As a State Registered Investment Advisor, The Practical Investor (TPI) manages private client investment portfolios using a proprietary investment strategy created by Chief Investment Officer Tony Cherniawski. Throughout 2000-01, when many investors felt the pain of double digit market losses, TPI successfully navigated the choppy investment waters, creating a profit for our private investment clients. With a focus on preserving assets and capitalizing on opportunities, TPI clients benefited greatly from the TPI strategies, allowing them to stay on track with their life goals.
Disclaimer: The content in this article is written for educational and informational purposes only. There is no offer or recommendation to buy or sell any security and no information contained here should be interpreted or construed as investment advice. Do you own due diligence as the information in this article is the opinion of Anthony M. Cherniawski and subject to change without notice.
Anthony M. Cherniawski Archive |
© 2005-2022 http://www.MarketOracle.co.uk - The Market Oracle is a FREE Daily Financial Markets Analysis & Forecasting online publication.


