


The Yield Curve Will Invert Soon. What’s Next for the Stock Market
Stock-Markets / Stock Markets 2018 Nov 27, 2018 - 04:39 PM GMTBy: Troy_Bombardia

 December is almost here, and some traders are looking forward to the Santa Claus Rally. We demonstrated that seasonality is not consistent. Hence, seasonality factors are of secondary importance.
Let’s determine the stock market’s most probable direction by objectively quantifying technical analysis. For reference, here’s the random probability of the U.S. stock market going up on any given day, week, or month.

*Probability ≠ certainty.
NAAIM
NAAIM measures the average exposure to U.S. stocks by active investment managers. This is a contrarian signal because most active investment managers (like most hedge funds) underperform buy and hold. They get very greedy after stocks go up and get bearish after stocks go down.
NAAIM is very low right now, at 31%
Here’s what happened next to the S&P 500 (historically) when NAAim fell to 31%
*Data from 2006 – present
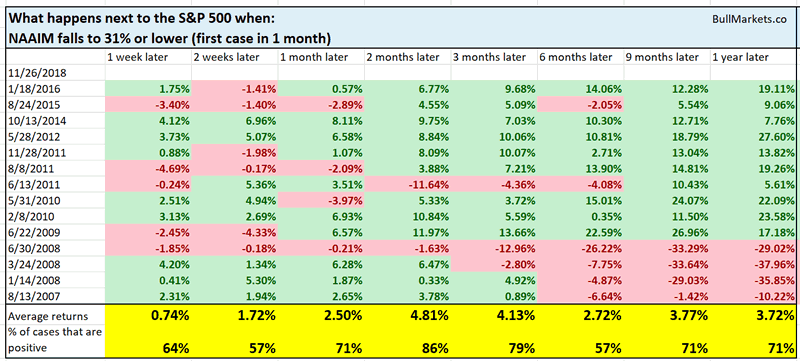
As you can see, the stock market tends to bounce 2 months later
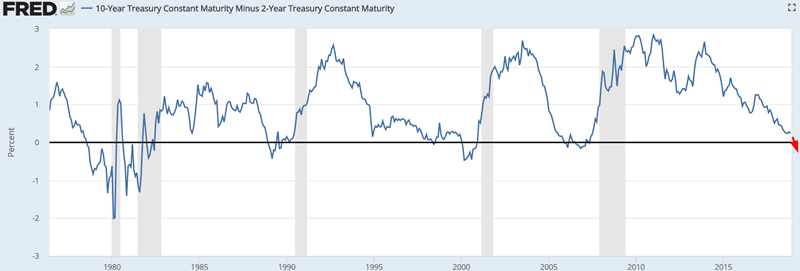
Inversion
It’s interesting how all of a sudden everyone has stopped talking about the impending yield curve inversion. The 10 year – 2 year yield curve will probably invert within the next 3 months.
Here’s what happens next to the S&P 500 when the yield curve inverts for the first time in each economic expansion.
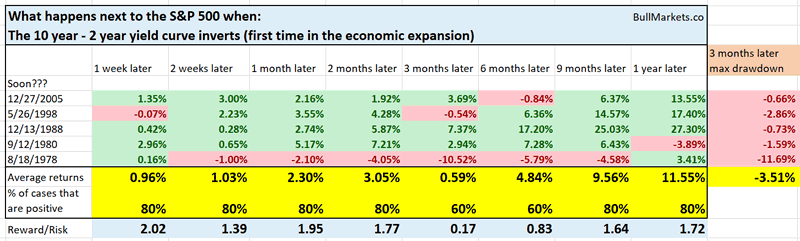
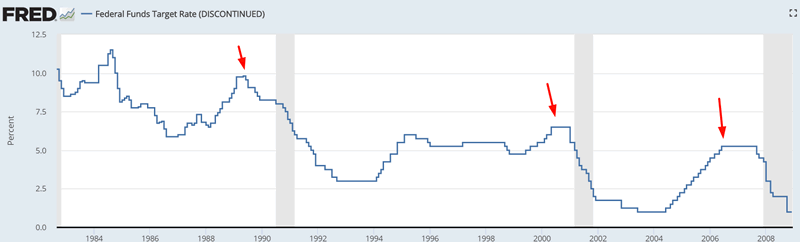
As you can see, stocks tend to do well, even after the inversion. Trouble for the stock market tends to start AFTER the Fed stops hiking interest rates, due to a notable slowdown in the economy. That’s why a spike in the yield curve is a better sign for long term stock market problems than a flattening yield curve. (Fed rate cuts = a spike in the yield curve)
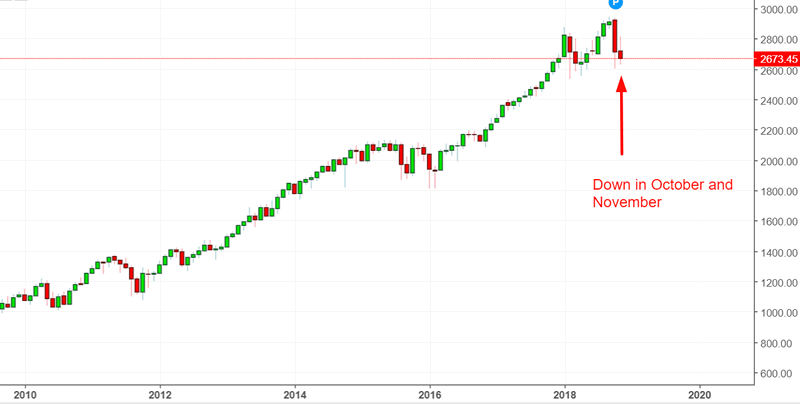
Down in October and down in November
If the S&P 500 doesn’t rise this week, it will have fallen in both October and November. The last time this happened was November 2008. But what about all the other times before that?
Here’s what happened next to the S&P 500 when it fell in both October and November.
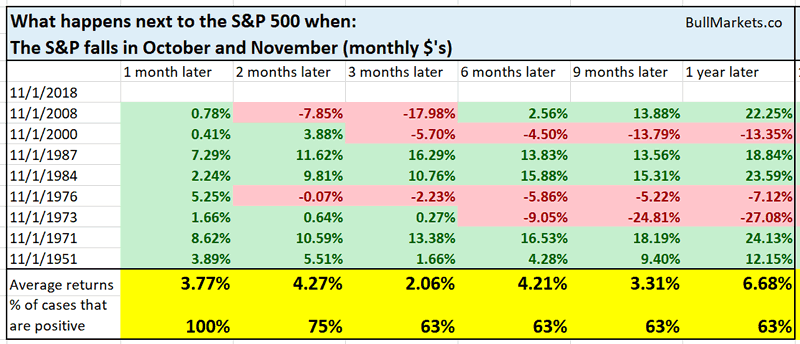
As you can see, some cases are bullish and some cases are bullish. But the notable thing is that there is no middle ground. Over the next 1 year, the stock market either declined significantly, or rallied significantly.
Click here to see yesterday’s market study
Conclusion
Our discretionary technical outlook has changed a little
- The current bull market will peak sometime in Q2 2019.
- The medium term remains bullish (i.e. approximately next half year).
- The short-medium term is mostly a 50-50 bet. With that being said, it leans bullish.
We focus on the medium term and long term. We mostly ignore the short term, which is usually just noise.
Our discretionary market outlook is not a reflection of how we’re trading the markets right now. We trade based on our clear, quantitative trading models, such as the Medium-Long Term Model.
Members can see exactly how we’re trading the U.S. stock market right now based on our trading models.
Click here for more market studies
By Troy Bombardia
I’m Troy Bombardia, the author behind BullMarkets.co. I used to run a hedge fund, but closed it due to a major health scare. I am now enjoying life and simply investing/trading my own account. I focus on long term performance and ignore short term performance.
Copyright 2018 © Troy Bombardia - All Rights Reserved
Disclaimer: The above is a matter of opinion provided for general information purposes only and is not intended as investment advice. Information and analysis above are derived from sources and utilising methods believed to be reliable, but we cannot accept responsibility for any losses you may incur as a result of this analysis. Individuals should consult with their personal financial advisors.
© 2005-2022 http://www.MarketOracle.co.uk - The Market Oracle is a FREE Daily Financial Markets Analysis & Forecasting online publication.