


The US Economy is Getting Worse. What this Means for Stocks
Stock-Markets / Stock Markets 2018 Nov 30, 2018 - 02:17 PM GMTBy: Troy_Bombardia

 The U.S. economy is starting to deteriorate, which is what typically happens in the last year of a bull market.
Let’s determine the stock market’s most probable direction by objectively quantifying technical analysis. For reference, here’s the random probability of the U.S. stock market going up on any given day, week, or month.

*Probability ≠ certainty.
The economy is deteriorating
The economy and the stock market move in the same direction in the long term. Hence, leading economic indicators are also long term leading stock market indicators.
Leading indicators are starting to show some signs of deterioration, but not enough for the bull market to peak. The usual chain of events looks like this:
- Housing – the earliest leading indicators – starts to deteriorate. Meanwhile, the U.S. stock market is still in a bull market while the rest of the U.S. economy improves. The rally gets choppy, with volatile corrections along the way. We are here right now
- The labor market starts to deteriorate. Meanwhile, the U.S. stock market is still in a bull market. This will likely happen in the first half of 2019
- The labor market deteriorates some more, while other economic indicators start to deteriorate. The stock market tops, and the bull market is over.
Let’s look at the data.
*Read today’s fundamental outlook. Fundamentals determine the stock market’s long term direction. Technicals determine the stock market’s medium term direction. As we approach the end of this bull market, fundamentals are more important than technicals. There is not a single technical indicator that can consistently predict bull market tops (without too many false signals). That’s why fundamentals are useful.
Housing Months of Supply
As we mentioned in our fundamental outlook today, Housing Months of Supply has been trending upwards recently.
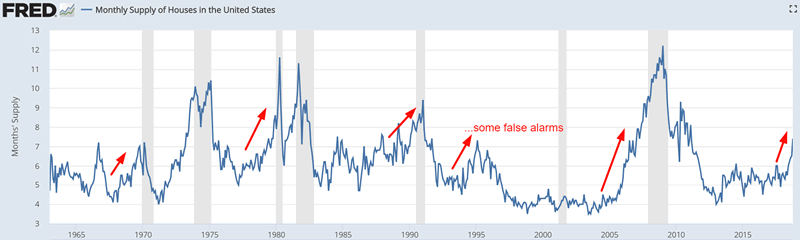
Is this immediately long term bearish for the stock market?
Here’s what happened next to the S&P after Housing Months of Supply exceeds 7.
*Data from 1964 – present
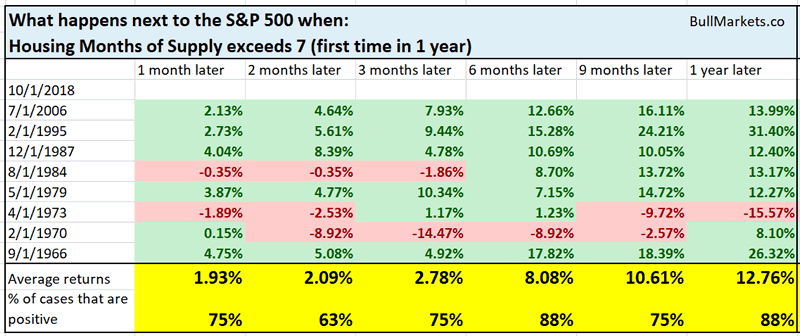
As you can see, the stock market tends to do well over the next 6 months, after which forward returns deteriorate.
In the final year of a bull market, the stock market goes up in a very volatile manner while the economy deteriorates.
Initial Claims
As we mentioned in our fundamental outlook today, Initial Claims has trended upwards a little recently.
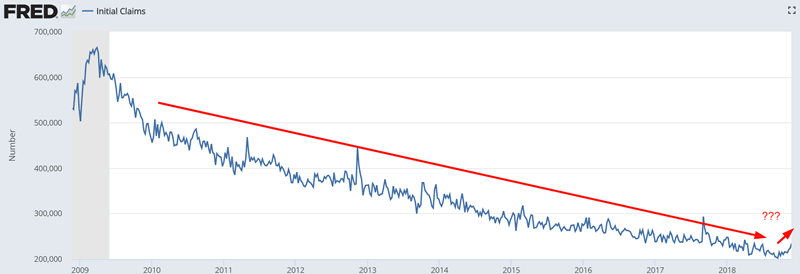
While this will be a long term bearish factor in 2019, I don’t think it’s a cause for concern right now.
In our free Golden/Death Cross Model with Initial Claims Filter, we want to see Initial Claims rise above its 1 year moving average for 8 consecutive weeks (i.e. a sustained rise in Initial Claims). So far, Initial Claims has been above its 1 year moving average for 2 consecutive weeks.
Here’s what happened next to the S&P when Initial Claims is above its 1 year average for 2 consecutive weeks while the S&P is below its 200 day moving average.
*Data from 1967 – present
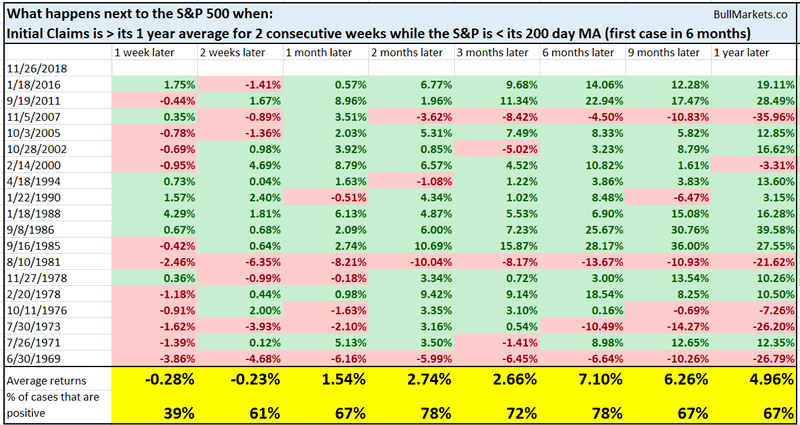
While this is slightly short term bearish for the stock market, it isn’t medium term or long term bearish for stocks.
Wait for Initial Claims to rise a little more before turning long term bearish.
Put/Call Ratio
The Put/Call ratio’s 20 day moving average was very high at the end of October, which coincided with the stock market’s bottom.
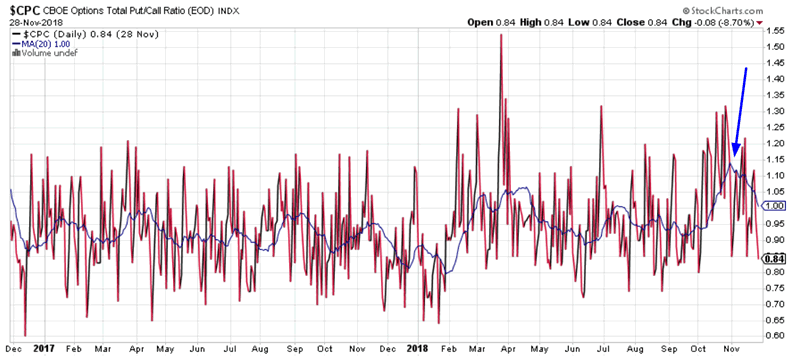
With the stock market bouncing off its lows, the Put/Call ratio has returned to normal.
Here’s what happened next to the S&P when the Put/Call ratio’s 20 day moving average went above 1.1 and then fell below 1 within the past month
*Data from 1995 – present
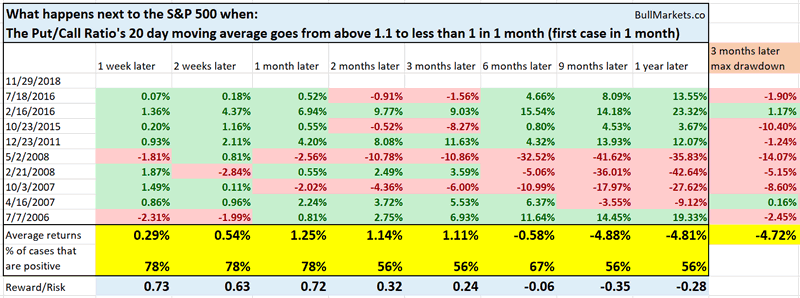
As you can see, this isn’t consistently bullish or bearish for the stock market on any time frame.
Big 3 day gains
Jodie Gunzberg (S&P Dow Jones Indices managing director, head of U.S. equities) said:
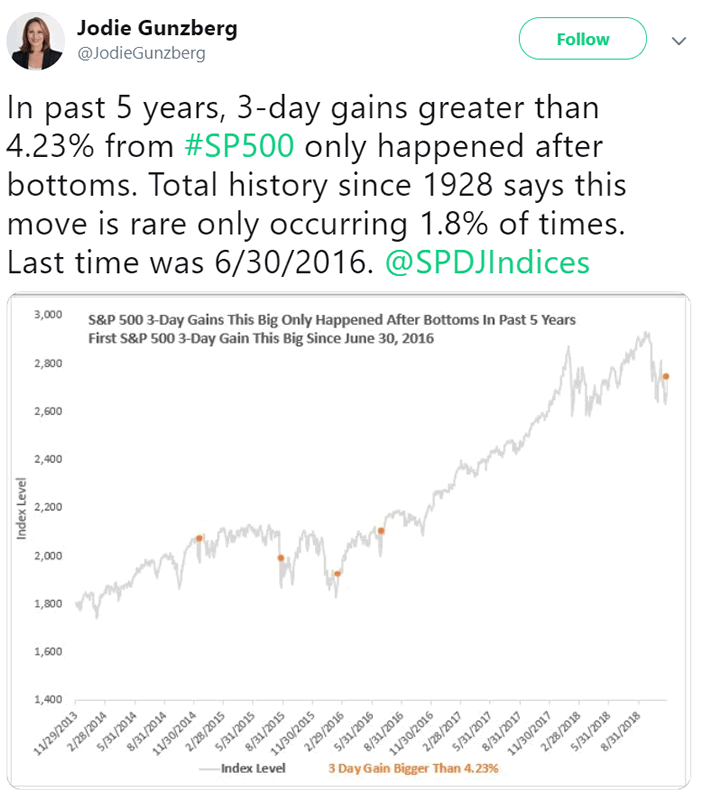
Is Jodie correct?
Here’s what happened next to the S&P 500 when it gained more than 4.2% over the past 3 days, while within 10% of a 2 year high.
*Data from 1928 – present
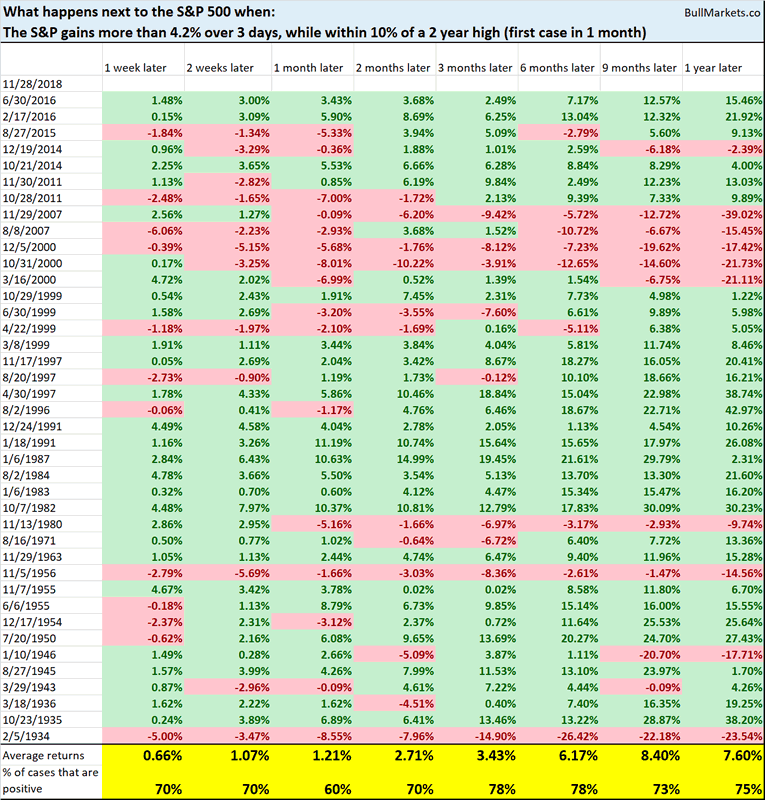
As you can see, this isn’t extremely bullish for stocks. Jodie’s mistake is that she uses limited data: “past 5 years”. Investors and traders should always look at the data holistically instead of selectively.
Click here to see yesterday’s market study
Conclusion
Our discretionary technical outlook remains the same:
- The current bull market will peak sometime in Q2 2019. Then a bear market will ensue.
- The medium term remains bullish (i.e. approximately next half year).
- The short-medium term is mostly a 50-50 bet.
We focus on the medium term and long term. We mostly ignore the short term, which is usually just noise.
Our discretionary market outlook is not a reflection of how we’re trading the markets right now. We trade based on our clear, quantitative trading models, such as the Medium-Long Term Model.
Members can see exactly how we’re trading the U.S. stock market right now based on our trading models.
Click here for more market studies
By Troy Bombardia
I’m Troy Bombardia, the author behind BullMarkets.co. I used to run a hedge fund, but closed it due to a major health scare. I am now enjoying life and simply investing/trading my own account. I focus on long term performance and ignore short term performance.
Copyright 2018 © Troy Bombardia - All Rights Reserved
Disclaimer: The above is a matter of opinion provided for general information purposes only and is not intended as investment advice. Information and analysis above are derived from sources and utilising methods believed to be reliable, but we cannot accept responsibility for any losses you may incur as a result of this analysis. Individuals should consult with their personal financial advisors.
© 2005-2022 http://www.MarketOracle.co.uk - The Market Oracle is a FREE Daily Financial Markets Analysis & Forecasting online publication.