


Stock Market Medium term Bullish, But Long Term Risk:Reward is Bearish
Stock-Markets / Stock Markets 2018 Dec 11, 2018 - 04:03 PM GMTBy: Troy_Bombardia

 Last week’s market outlook was not clearly explained, so I would like to clarify.
Our models have not yet turned long term bearish, although they are getting close to turning long term bearish. But while building new and better models like the Macro Index, I’ve come to realize that at least from a long term risk:reward perspective, it doesn’t favor long term bulls. Market outlook and risk:reward are not the same thing. Here’s an example.
Let’s assume that there’s a 80% probability that the stock market goes up from here, which means there’s a 20% probability the stock market goes down from here. While on the surface this seems bullish, it fails to take into account risk:reward. If the risk:reward is 5:1, then the expected outcome factors neither bulls nor bears. (5x probability of the stock market going up, but 5x the downside risk. These 2 things cancel each other out.)
Goldman Sachs has a very simple Bull/Bear Indicator which illustrates this point.
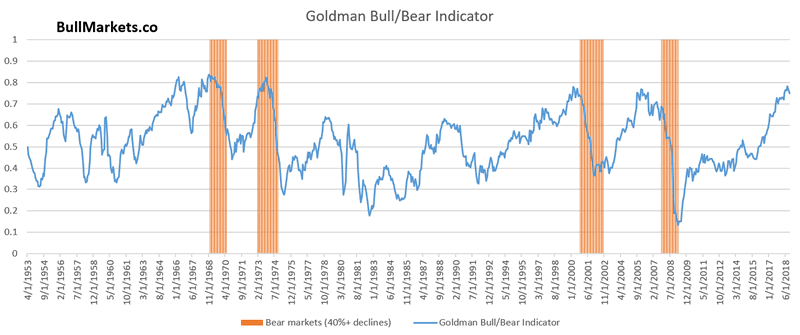
*This Bull/Bear Indicator is constructed by taking a percentile for the Unemployment Rate, Inflation, Yield curve, ISM manufacturing, and P/E ratio
As you can see, Goldman’s Bull/Bear Indicator is quite high, historically speaking. Is this immediately long term bearish? No. This indicator can remain very high for 1-2 years. This means that while the indicator is not long term bearish (i.e. it is not a timing indicator), it demonstrates that long term risk:reward points to the downside.
Go here to understand our fundamentals-driven long term outlook.
Let’s determine the stock market’s most probable medium term direction by objectively quantifying technical analysis. For reference, here’s the random probability of the U.S. stock market going up on any given day, week, or month.

*Probability ≠ certainty. Past performance ≠ future performance. But if you don’t use the past as a guide, you are walking into the future blindly.
Russell’s significant underperformance
The small caps Russell 2000 Index has been much weaker than the large caps Dow. The Russell is more than -16% below its 1 year high, while the Dow is less than -10% from its 1 year high.
Some traders think this means that the Dow will “catch down” with the Russell, thereby bringing the broad S&P 500 down. Are they correct?
Here’s what happened next to the S&P when the Russell fell more than -16% from a 1 year high while the Dow fell less than -10% from a 1 year high.
*Data from 1987 – present
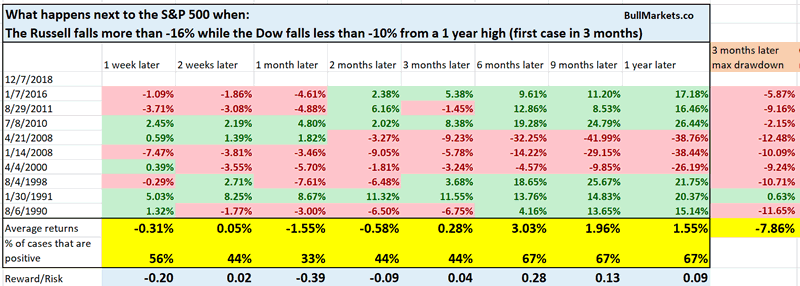
As you can see, the S&P tends to face weakness over the next 1 month, after which forward returns start to improve. It’s interesting how our 1 month forward market studies are mixed right now. Some are bullish and some are bearish. This demonstrates how the market can go either way in the short term right now.
MACD
The MACD(12,26,9) monthly made a bearish cross at the end of November. Of course, the bears eyeball the chart and state “this is long term bearish for the stock market”.
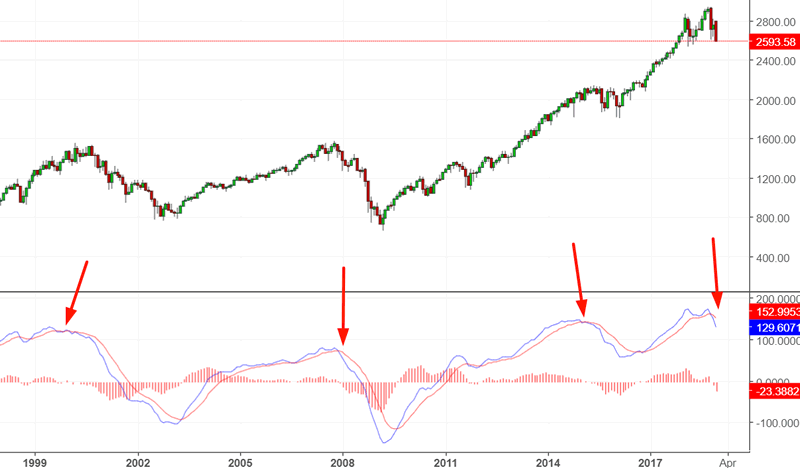
The problem with “eyeballing” a chart is that you tend to see what you want to see, while ignoring the historical cases that don’t match your pre-existing market outlook.
Here’s what happened next to the S&P 500 when its MACD(12,26,9) monthly histogram crossed below zero.
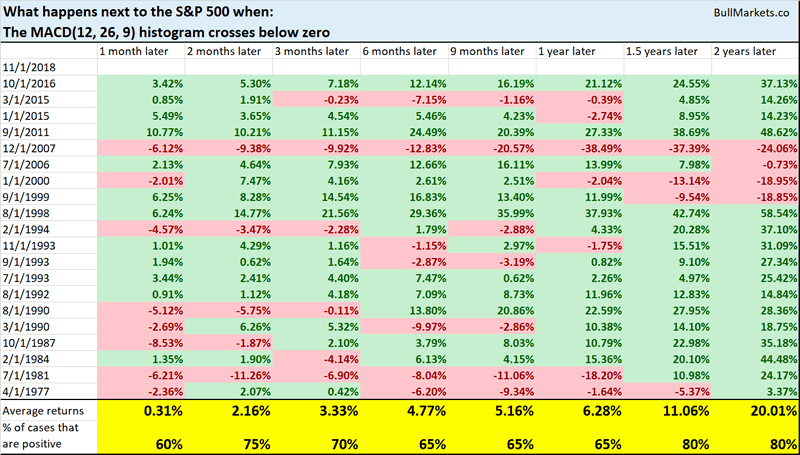
As you can see, this isn’t consistently bearish for the stock market on any time frame. Technical analaysis on its own is incapable of catching long term tops without too many false signals.
S&P’s new low
The S&P fell to a 150 day new low today (approximately 7 months), for the first time in 2 years. In other words, after a long time, the trend is weakening. (The February 2018 correction didn’t fall to a 150 day new low, because the stock market rallied so much from mid-2017 to 2018).
Here’s what happened next to the S&P 500 when it fell to a 150 day low for the first time in 2 years.
*Data from 1950 – present
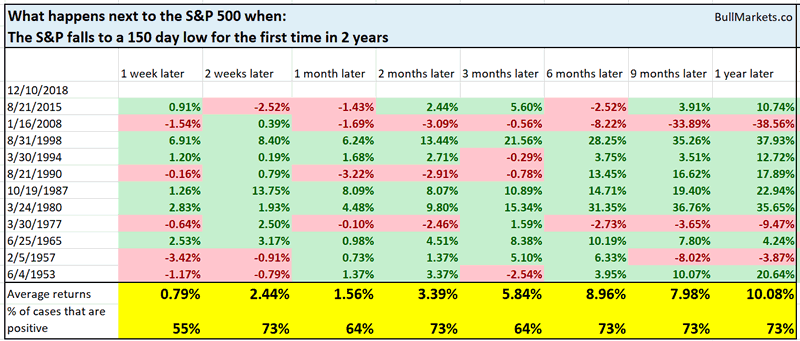
As you can see, this isn’t consistently bullish or bearish for the stock market on any time frame, although there is a slight bullish lean over the next 2 weeks.
XLU
We’ve talked about XLU’s outperformance several times here at Bull Markets. (XLU = utilities, a defensive sector).
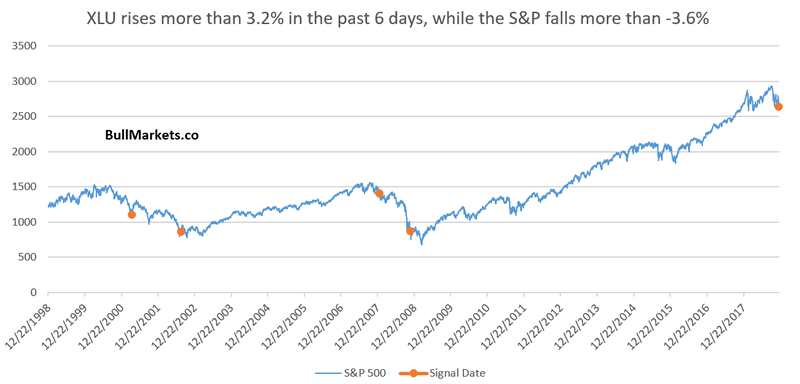
XLU has risen more than 3.2% in the past 6 days, while the S&P falls more than -3.6% in the past 6 days.
From 1998 – present, this has only happened 4 other times.
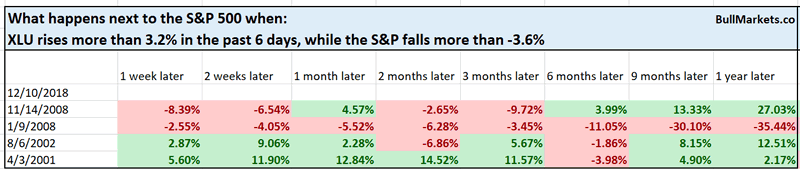
Is this long term bearish for the stock market? I don’t think so.
- n = 4
- 3 of the 4 cases happened afer the S&P was already deep in a bear market. Which leaves us with 1 case that’s similar to today: January 9, 2008. In other words, n = 1
Our market studies have been mixed recently, which highlights that towards the end of bull markets, fundamentals are more useful than technicals.
Conclusion
Here is our discretionary market outlook:
- For the first time since 2009, the U.S. stock market’s long term risk:reward is no longer bullish. This doesn’t necessarily mean that the bull market is over. We’re merely talking about long term risk:reward.
- The medium term direction is still bullish (i.e. trend for the next 6-9 months)
- The short term is a 50/50 bet
Our discretionary outlook is not a reflection of how we’re trading the markets right now. We trade based on our clear, quantitative trading models, such as the Medium-Long Term Model.
Members can see exactly how we’re trading the U.S. stock market right now based on our trading models.
Click here for more market studies.
By Troy Bombardia
I’m Troy Bombardia, the author behind BullMarkets.co. I used to run a hedge fund, but closed it due to a major health scare. I am now enjoying life and simply investing/trading my own account. I focus on long term performance and ignore short term performance.
Copyright 2018 © Troy Bombardia - All Rights Reserved
Disclaimer: The above is a matter of opinion provided for general information purposes only and is not intended as investment advice. Information and analysis above are derived from sources and utilising methods believed to be reliable, but we cannot accept responsibility for any losses you may incur as a result of this analysis. Individuals should consult with their personal financial advisors.
© 2005-2022 http://www.MarketOracle.co.uk - The Market Oracle is a FREE Daily Financial Markets Analysis & Forecasting online publication.