


Market Confusion About the Yield Curve Inversion
Interest-Rates / Inverted Yield Curve Dec 15, 2018 - 05:02 PM GMTBy: Donald_W_Dony

 Last week, the 5-year Treasury note fell below the 2-year note causing many market watchers to suggest the US Yield Curve is inverting. And as the Curve is a leading indicator to the stock market, the bears came out in force declaring the party has ended.
Nothing could be further from the truth.
The more important yield comparison to watch is the 2-year Treasury note versus the 10-year note.
Lower yields for longer-dated Treasuries relative to shorter-dated Treasuries suggest traders expect economic conditions to soften, thereby easing inflationary pressures. If, in contrast, they expect inflation pressures to intensify, they would demand higher yields on longer-dated bonds.
While the 10-year note continues to yield more than the 2-year note, the gap is decreasing (Chart 1).
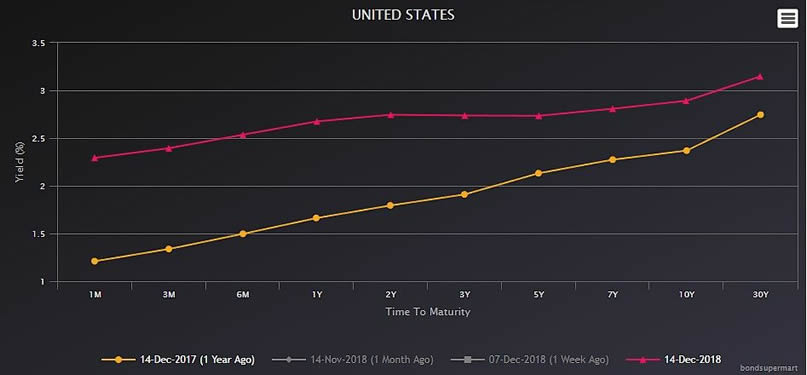
The comparison between the 10 and 2-year rates is the most important way to evaluate the yield curve.
Since the mid-1970s, every economic recession in the U.S. was preceded by an inverted yield curve.
Even if the curve were to invert, it does not mean a recession is imminent. The length of time between inversion and the start of the recession has varied between 10 and 18 months.
Chart 1 shows the current yield curve (red line) and the curve one year ago (yellow line).
Another interesting indicator of recessions is housing starts (Chart 2).
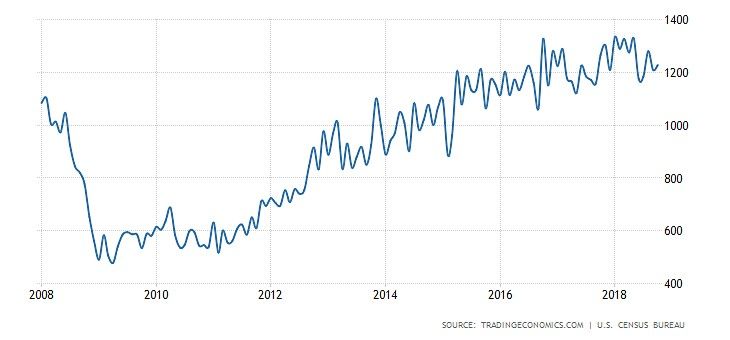
Seven out of the last eight recessions were preceded or accompanied by a drop of at least 30% in housing starts. Though the housing market has eased over the last 12 months, it’s nowhere near recessionary levels. Housing starts in October 2018 were down just 2.9% from October 2017.
Bottom line: Given the time-tested evidence, it would be a stretch for any analyst to suggest the secular bull market is at an end.
Though the current market weakness creates the opportunity for the bears to come out, the present position of the US Yield Curve and Housing starts should over ride most concerns.
By Donald W. Dony, FCSI, MFTA
www.technicalspeculator.com
COPYRIGHT © 2018 Donald W. Dony
Donald W. Dony, FCSI, MFTA has been in the investment profession for over 20 years, first as a stock broker in the mid 1980's and then as the principal of D. W. Dony and Associates Inc., a financial consulting firm to present. He is the editor and publisher of the Technical Speculator, a monthly international investment newsletter, which specializes in major world equity markets, currencies, bonds and interest rates as well as the precious metals markets.
Donald is also an instructor for the Canadian Securities Institute (CSI). He is often called upon to design technical analysis training programs and to provide teaching to industry professionals on technical analysis at many of Canada's leading brokerage firms. He is a respected specialist in the area of intermarket and cycle analysis and a frequent speaker at investment conferences.
Mr. Dony is a member of the Canadian Society of Technical Analysts (CSTA) and the International Federation of Technical Analysts (IFTA).
Donald W. Dony Archive |
© 2005-2022 http://www.MarketOracle.co.uk - The Market Oracle is a FREE Daily Financial Markets Analysis & Forecasting online publication.