


Gold Explodes Higher as US Treasury Builds Toxic Bond Portfolio
Commodities / Gold & Silver Sep 21, 2008 - 12:20 PM GMTBy: Joe_Nicholson

 “We shouldn't be surprised to see gold near $900 and silver near $15 in the short term, though this won't necessarily mean a bottom is in place. ~ Precious Points: Topping the Copper Top, August 30, 2008
“Just how much money is there? The answer, of course, is virtually infinite. In the short term, precious metals will continue to trade along with many commodities opposite the dollar, which may be bullish because many commodities appear ready for a relief rally as the dollar prepares to consolidate.” ~ Precious Points: Full Faith and Credit, September 6, 2008
Capital constrained, and it don't look good? Who you gonna call? The invisible hand wants your firm dead? Wall Street showed the world who it's gonna call in an all out meltdown of the financial system, and it was precious metals. Those who'd taken to downplaying their role as useful commodities had forgotten the ultimate and most important utility of gold and silver: they are the most compact and efficient fungible store of wealth.
Of course, now that the Treasury is offering to pay the lowest bidder for its toxic portfolio, the excitement that took gold to its single highest single day gain in history may be abating. On the other hand, the government tipped its hand last week revealing its limitless ability to create money out of thin air, which doesn't particularly quell the long term gold bulls. A lot will depend on exactly what plan is adopted and how it is managed, and we shouldn't underestimate the ability of Congress to pass a compromise bill that ultimately makes no one happy. But even if turns out the government gets a lot of this mortgage paper at fire sale prices and ultimately turns a profit, in the meantime, it's still a heck of a lot of new money entering the system all at once.
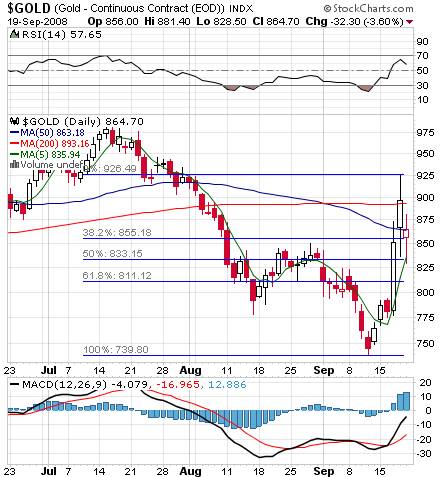
Gold vastly improved its technical picture last week with an obviously impulsive move that saw crucial support and resistance at the 50-day sma. The trading range between $835 and $865 is somewhat bullish, but slight indecisive. If gold is indeed putting in a small fourth wave with a fifth to come, we should see at least one more push above the most recent high. And whereas as some might be ready to rush in to call a bottom here, the purist can honestly say that absolute certain confirmation is not yet in place.
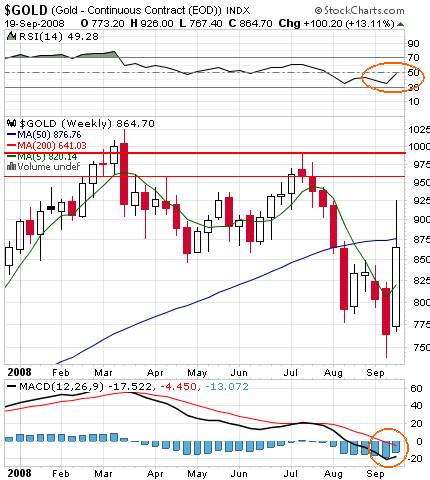
This caution is more apparent in the weekly chart, where MACD is only now starting to attempt a bullish crossover, and where RSI has not yet crept over the centerline. While both of these bullish signals may eventually be realized, they should be monitored for potential resistance areas. Higher levels that should prove difficult to surmount in the case of a fifth wave up are the previous highs in the $950-$1000 range.
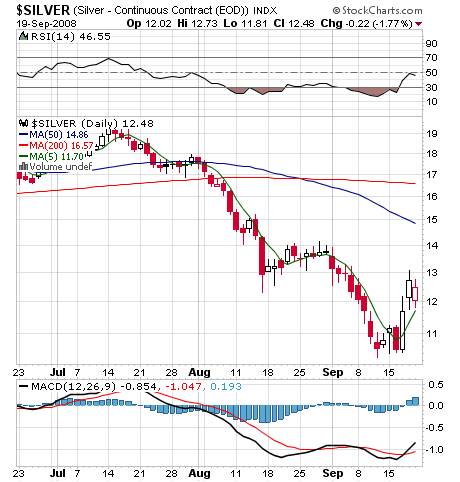
Silver fared well on a percentage basis, but was not able to reach is 50-day sma, which would have seen it near $15 as previously expected. Concerns about demand in the global economy appear to be albatross around the neck of base metals in general and silver is showing the darkside of its dual nature. This, of course, gives silver explosive potential if economic signals improve. In the short term, there's support at the 5-day sma and resistance at $14 and the recent high.
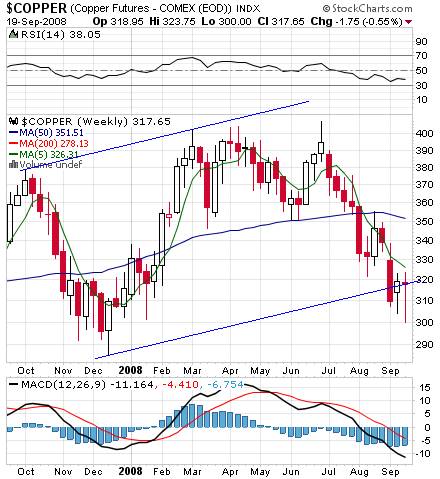
And underscoring the ambiguity towards the system in this period of historic upheavals is the drop in copper out of the ending diagonal parallels over the last three weeks, suggesting the pattern is no longer valid. Good support at $3, however, and a weekly close just barely within the parallels, is just enough to keep this chart on radar screens in the coming week. Staying within the parallel, of course, and getting above the 5-week sma at $3.26 should all be objective for the next several days if copper is indeed going to enjoy a period of relative calm on the government bailout and produce new highs sometime later in the year or early 09.
In the end, this week was a much-needed reaffirmation to precious metals bulls, one that was undeniable and proved to the world that gold and silver cannot be relegated to the dustbins of economic history. Even if new all time highs are not right around the corner, the buying last week in the electronic markets reflects the strong demand for physical metals that continued unabated even during the recent selloffs. And entering the strong seasonal period for metals, this demand is the best case for further bullish price action from here.
by Joe Nicholson (oroborean)
This update is provided as general information and is not an investment recommendation. TTC accepts no liability whatsoever for any losses resulting from action taken based on the contents of its charts,, commentaries, or price data. Securities and commodities markets involve inherent risk and not all positions are suitable for each individual. Check with your licensed financial advisor or broker prior to taking any action.
Joe Nicholson Archive |
© 2005-2022 http://www.MarketOracle.co.uk - The Market Oracle is a FREE Daily Financial Markets Analysis & Forecasting online publication.