


Macro Could Weaken After US Government Shutdown. What This Means for Stocks
Stock-Markets / Stock Markets 2019 Jan 17, 2019 - 10:33 AM GMTBy: Troy_Bombardia

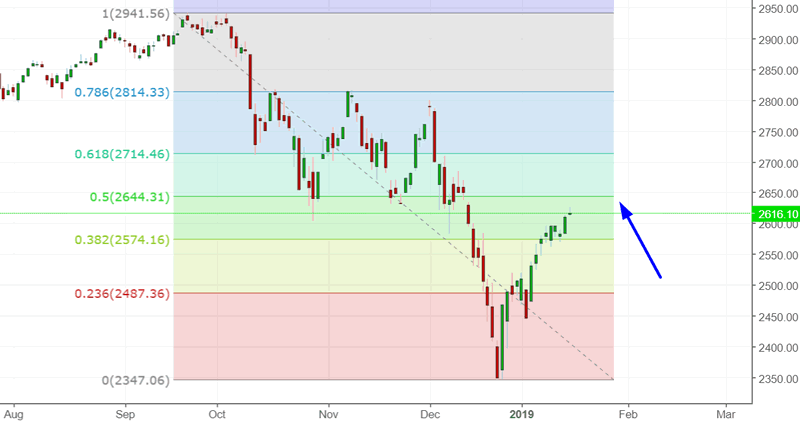
 The S&P is close the reaching its 50% retracement, which is the standard target before a pullback/retest. After the pullback/retest, what happens next depends on the macro economy. If the macro economy deteriorates, then stocks will keep going down. If the macro economy weakens, then stocks will keep going up. But even if the bull market has more room left, it doesn’t have a lot of room. A 1999-scenario (1 last year of the bull market) is a best case scenario.
Go here to understand our fundamentals-driven long term outlook.
Let’s determine the stock market’s most probable medium term direction by objectively quantifying technical analysis. For reference, here’s the random probability of the U.S. stock market going up on any given day.

*Probability ≠ certainty. Past performance ≠ future performance. But if you don’t use the past as a guide, you are blindly “guessing” the future.
Macro economy
We have published fewer macro economic posts recently because of the government shutdown. The shutdown impacts the release of macro data.
With that being said, macro is mixed right now (some leading indicators turning long term bearish, some still bullish). Being mixed at the tail end of an economic expansion is not good, because the downside risk is much higher than the upside reward.
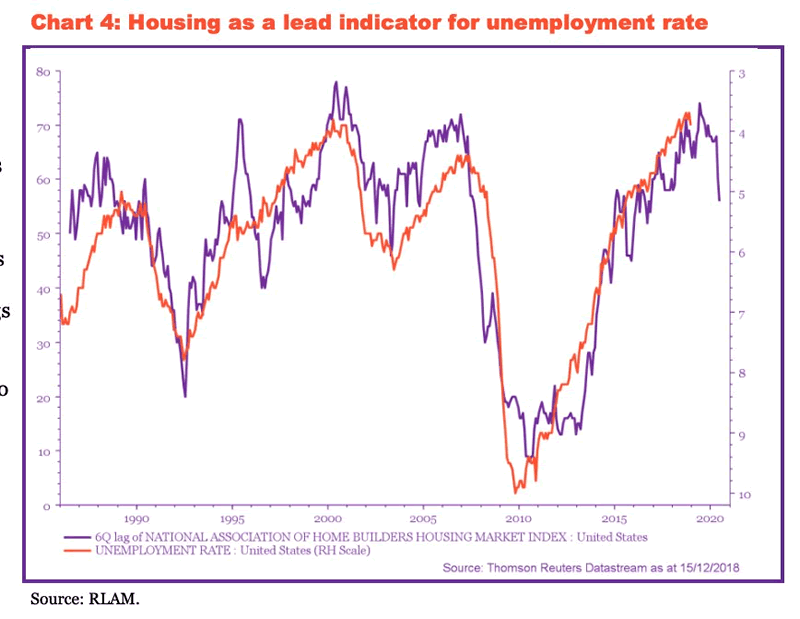
Here is an interesting chart, demonstrating how the housing market (a long term leading indicator) leads the Unemployment Rate. Should the weakness in housing persist, the unemployment rate will start to pick up, which means that we are getting closer and closer to the start of a recession.
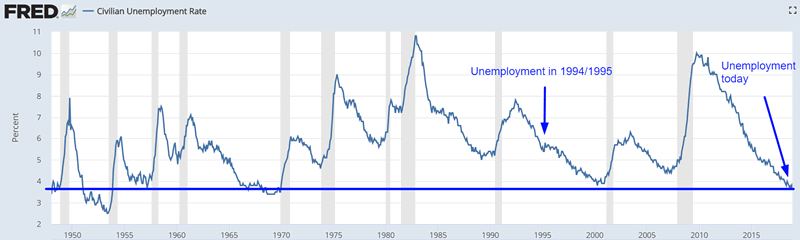
So why can’t this be a false signal, just like 1994-1995? Because unemployment is much lower today than where it was in 1994-1995. The economy is much closer to “as good as it gets”.
*Moreover, macro data has a >50% chance of weakening after the prolonged government shutdown.
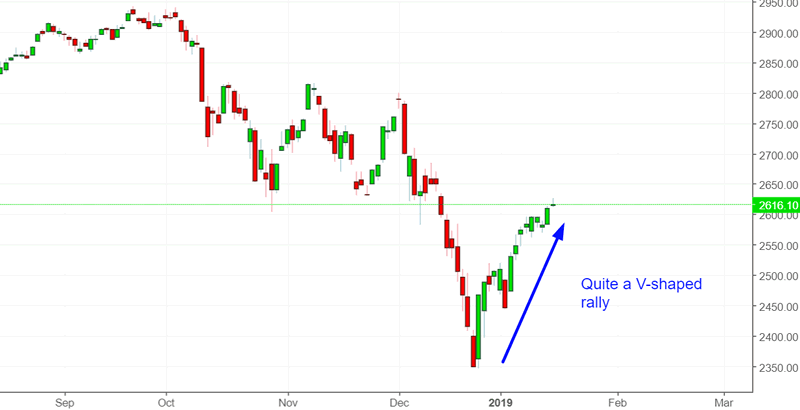
V-shaped rally
As the stock market rallies, our medium term market studies are becoming more and more mixed.
There’s a first time for everything. From 1962 – present, this is the first time the S&P has closed higher than the daily OPEN for at least 13 of the past 15 days while the S&P is under its 200 dma. In other words, quite a V-shaped and persistent rally.
To expand the sample size, let’s look at ALL the cases in which the S&P closed higher than the daily OPEN for at least 13 of the past 15 days (regardless of whether the S&P was above or below its 200 dma).
Is this a short term bearish sign for stocks?
*Data from 1962 – present
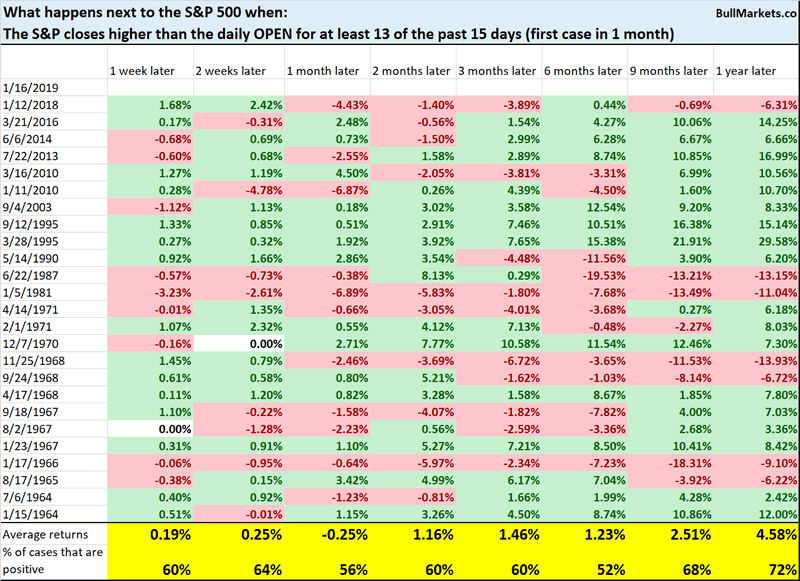
This isn’t consistently bearish on any time frame. However, the S&P’s 6 month forward returns were worse than random.
Macro Context
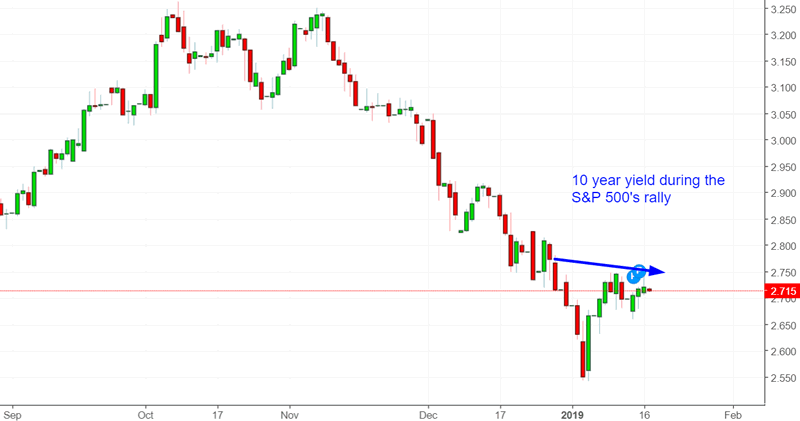
Treasury yield
The S&P has gone up more than 10% over the past 3 weeks while the 10 year Treasury yield has fallen. This is uncommon, because in a post-panic stock market rally, yields will often rise with stocks.
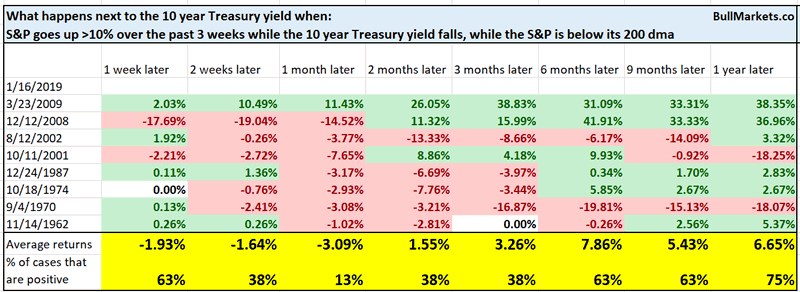
Here’s what happened next to the S&P when it went up more than 10% over the past 3 weeks while the 10 year yield fell, while the S&P is below its 200 dma (first case in 1 month)
*Data from 1962 – present
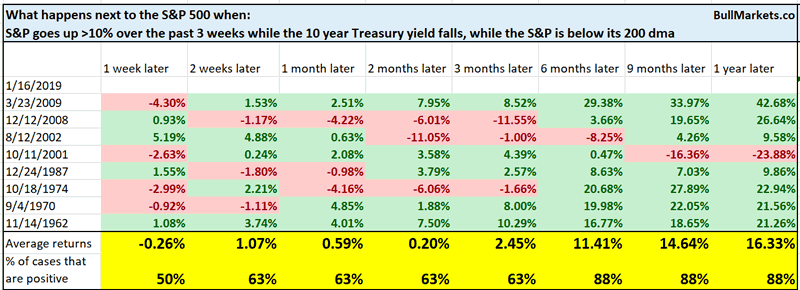
Most bullish for stocks 6-12 months later, with the exception of 2001.
Meanwhile, this is a short term bearish factor for Treasury yields (bullish for bonds).
Seasonality
While many quants use seasonality, we consider seasonality factors to be of tertiary importance. Nevertheless, seasonality remains popular.
There’s a widespread belief among traders that “as January goes, so goes the rest of the year”.
The stock market has started 2019 on a strong footing. It has rallied more than 4% in the first 11 trading days of each year.
Here’s what happens next to the S&P 500 when it goes up more than 4% in the first 11 trading days of each year.
*Data from 1923 – present
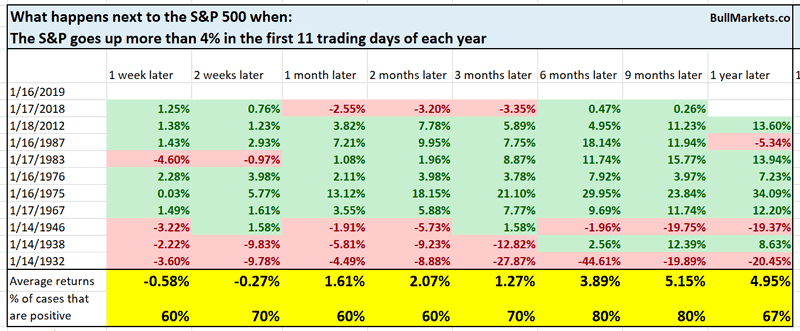
You can see that the S&P was consistently bullish 6-9 months later from 1950-present. But pre-1950 (and in 2018), it was bearish. This is why we say “seasonality works until it doesn’t”. Patterns that don’t make much sense can change at any point.
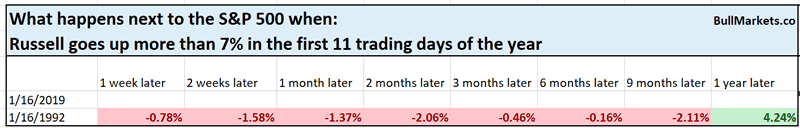
Like the S&P, the Russell 2000 (small caps index) has started 2019 on a very strong footing. This is the strongest start for the Russell since 1987.
Here’s what happened next to the S&P when the Russell went up more than 7% in the first 11 trading days of each year.
*Data from 1987 – present
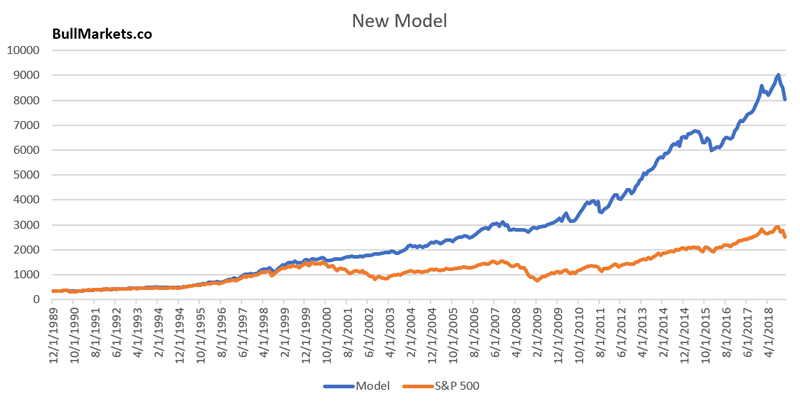
Model
We’re working on improving our models and adding new ones in the Membership Program. Here’s a look at one of the new ones (in blue), overlapped onto a chart of the S&P 500 (in orange).
Russell 2000
After a horrible Q4 2018, small caps are rallying significantly. The Russell 2000 has finally broken above its 50 dma for the first time in a long time.
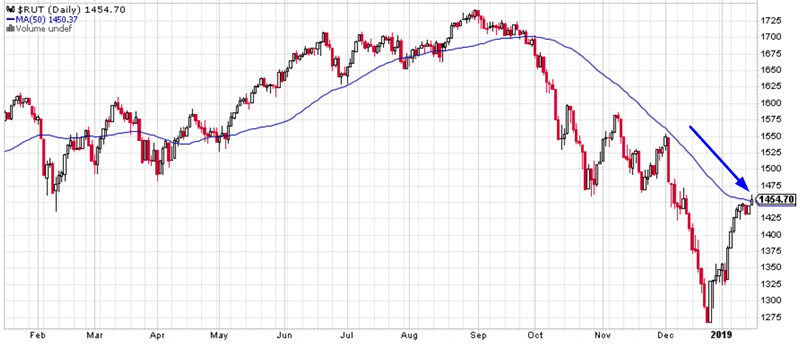
Here’s what happens next to the S&P when the Russell breaks above its 50 dma for the first time in 3 months
*Data from 1987 – present
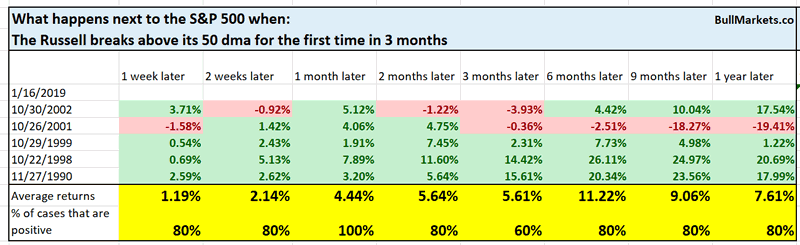
As you can see, the Russell’s breakout usually continues. So while a short term pullback/retest is the most likely scenario, there is a small possibility that the stock market will continue to recover in a V-shape.
Click here for yesterday’s market study
Conclusion
Here is our discretionary market outlook:
- The U.S. stock market’s long term risk:reward is no longer bullish. This doesn’t necessarily mean that the bull market is over. We’re merely talking about long term risk:reward. Long term risk:reward is more important than trying to predict exact tops and bottoms.
- The medium term direction (i.e. next 3-6 months) is neutral. Some market studies are medium term bullish while others are medium term bearish
- The stock market’s short term has a slight bearish lean. Focus on the medium-long term (and especially the long term) because the short term is extremely hard to predict.
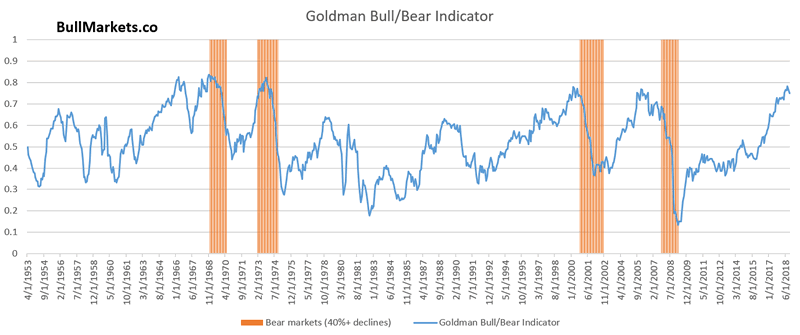
Goldman Sachs’ Bull/Bear Indicator demonstrates that while the bull market’s top isn’t necessarily in, risk:reward does favor long term bears.
Our discretionary market outlook is not a reflection of how we’re trading the markets right now. We trade based on our clear, quantitative trading models, such as the Medium-Long Term Model.
Members can see exactly how we’re trading the U.S. stock market right now based on our trading models.
Click here for more market studies
By Troy Bombardia
I’m Troy Bombardia, the author behind BullMarkets.co. I used to run a hedge fund, but closed it due to a major health scare. I am now enjoying life and simply investing/trading my own account. I focus on long term performance and ignore short term performance.
Copyright 2019 © Troy Bombardia - All Rights Reserved
Disclaimer: The above is a matter of opinion provided for general information purposes only and is not intended as investment advice. Information and analysis above are derived from sources and utilising methods believed to be reliable, but we cannot accept responsibility for any losses you may incur as a result of this analysis. Individuals should consult with their personal financial advisors.
© 2005-2022 http://www.MarketOracle.co.uk - The Market Oracle is a FREE Daily Financial Markets Analysis & Forecasting online publication.