


Is S&P 500 Ready to Make All-Time High?
Stock-Markets / Stock Markets 2019 Jan 30, 2019 - 10:59 AM GMT

S&P 500 formed a significant high at 2947 on Sept 21, 2018 after a 342% rally in 10 years. During the entire rally from year 2009 low, there was no major correction in the Index, that is until last year. In less than 3 months, the Index has dropped 21.4% from the peak. The Index bottomed at 2316.75 on December 26, 2018. It has now retraced more than 50% of the decline.
Is the bull market ready to resume higher? Not so fast. In the following chart, we will show how the Index can face a major resistance in coming days / weeks. The important key pivot remains last year’s high at 2947. As far as this level holds, the Index can still extend lower to break below Dec 26, 2018 low at 2316.75 or pullback in 3 waves at least.
S&P 500 E-Mini Futures ($ES_F) Long Term Technical Chart
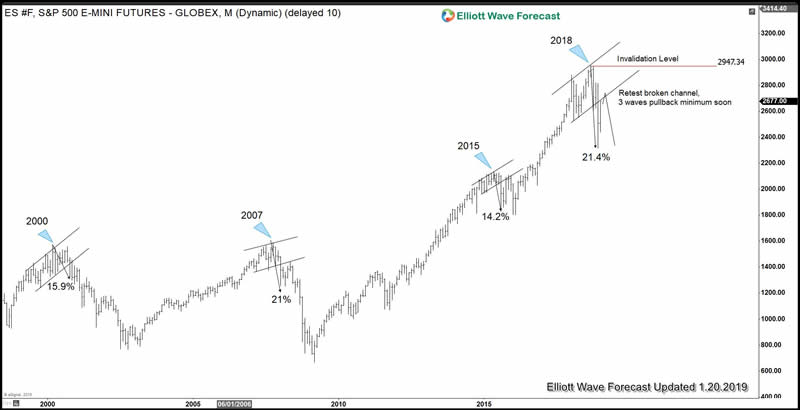
Weekly chart on S&P 500 E-Mini Futures above shows 4 major corrections since year 2000. In all cases, the initial leg of the decline was more than 10% and broke below an ascending bullish channel. After the initial break of the channel, we can see the Index rallied to retest the broken channel in year 2000, 2007, and 2015. Each time, the retest failed and the Index then reversed lower and broke the previous low of the initial decline.
The current situation is similar to these previous 3 major tops. We had a 21.4% correction since the top in year 2018 which is the initial leg of the decline that broke an ascending bullish channel. The Index has rallied and corrected more than 50% of the initial decline, now retesting the broken channel. As far as last year’s pivot high at 2947 stays intact, the Index can start to rollover and pullback in 3 waves soon at least. If history is any indication, it can even break below the low on December 26, 2018 at 2316.75.
S&P 500 E-Mini Futures ($ES_F) Elliott Wave Chart
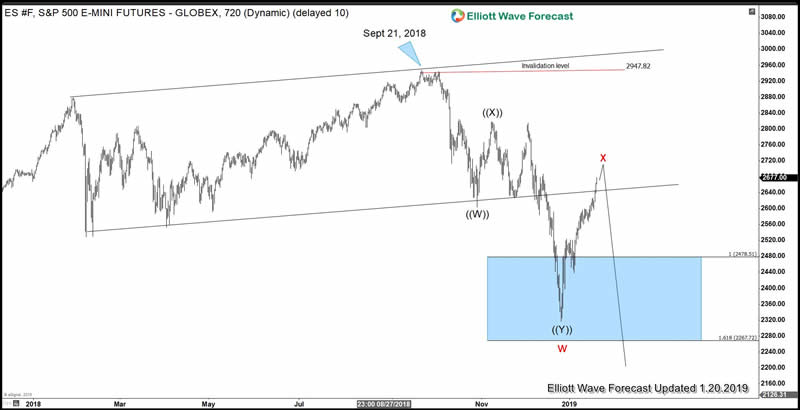
The initial decline from September 21, 2018 (2947) to 2316.75 is clearly in 3 swing. We label this correction as ((W))-((X))-((Y)) which in Elliott Wave is also known as a double three. We need to keep in mind that the structure of the selloff so far is not impulsive (5 waves). Thus, as far as the current data shows, it doesn’t support a major bear market. However, the current correction still has scope to extend lower, thus making it the biggest correction since 2009 low. As far key level at 2947 high holds, Index still can extend lower and break below 2316.75. Potential target to the downside is 100% Fibonacci extension of the red w-x from September 21, 2018 high in-the 2000 area.
To conclude: The structure of the selloff in S&P 500 from September 21, 2018 high last year is corrective which does not support a major bear market. However, the current correction can become the largest correction since 2009 low and as far as the rally fails below last year’s high at 2947, more downside to 2000 area can happen.
To get regular Elliott Wave update and analysis on 78 instrument, we welcome you to take 14 days FREE trial. We offer comprehensive service including charts, live session, chat room, signal, and more.
S&P 500 E-Mini Futures ($ES_F) Video

By EWFHendra
https://elliottwave-forecast.com
ElliottWave-Forecast has built its reputation on accurate technical analysis and a winning attitude. By successfully incorporating the Elliott Wave Theory with Market Correlation, Cycles, Proprietary Pivot System, we provide precise forecasts with up-to-date analysis for 52 instruments including Forex majors & crosses, Commodities and a number of Equity Indices from around the World. Our clients also have immediate access to our proprietary Actionable Trade Setups, Market Overview, 1 Hour, 4 Hour, Daily & Weekly Wave Counts. Weekend Webinar, Live Screen Sharing Sessions, Daily Technical Videos, Elliott Wave Setup .
Copyright © 2019 ElliottWave-Forecast - All Rights Reserved Disclaimer: The above is a matter of opinion provided for general information purposes only and is not intended as investment advice. Information and analysis above are derived from sources and utilising methods believed to be reliable, but we cannot accept responsibility for any losses you may incur as a result of this analysis. Individuals should consult with their personal financial advisors.
© 2005-2022 http://www.MarketOracle.co.uk - The Market Oracle is a FREE Daily Financial Markets Analysis & Forecasting online publication.