


Is the Stock Market Ever Going to Pullback?
Stock-Markets / Stock Markets 2019 Feb 03, 2019 - 01:27 PM GMTBy: Troy_Bombardia

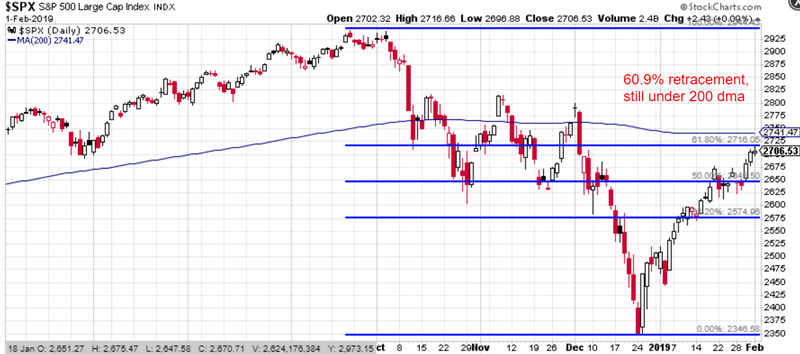
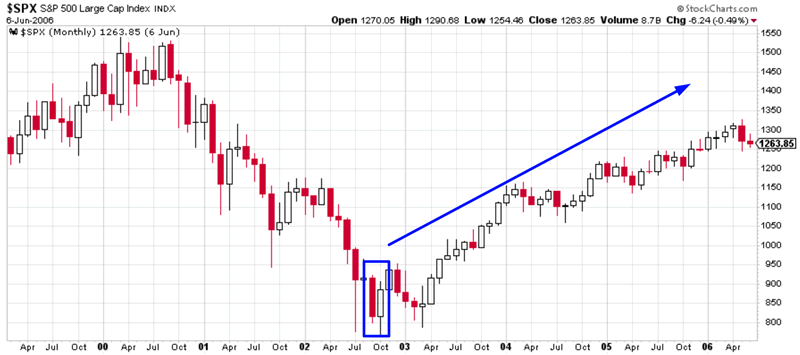
 By now everyone is aware that these “crash & rally” patterns are usually followed by a pullback or retest. Most of these pullbacks/retests occur once the S&P has reached its 50% retracement. But with the S&P now having retraced 60% of its Q4 2018 decline, many traders are doubting whether or not the S&P will pullback/retest at all, or if it’s going straight to new all time highs.
Go here to understand our fundamentals-driven long term outlook.
Let’s determine the stock market’s most probable medium term direction by objectively quantifying technical analysis. For reference, here’s the random probability of the U.S. stock market going up on any given day.

*Probability ≠ certainty. Past performance ≠ future performance. But if you don’t use the past as a guide, you are blindly “guessing” the future.
Reviewing the charts
Yes, it’s true that most of these 15-20% declines are followed by a pullback/retest at the 50% retracement level.
HOWEVER, not all of them do.
- A few are followed by a pullback/retest after the S&P has rallied even more
- A few are followed by a pullback/retest after the S&P rallied less
Here are the historical cases.
The stock market crashed and retraced 48% before retesting in 2011. The S&P was under its 200 dma
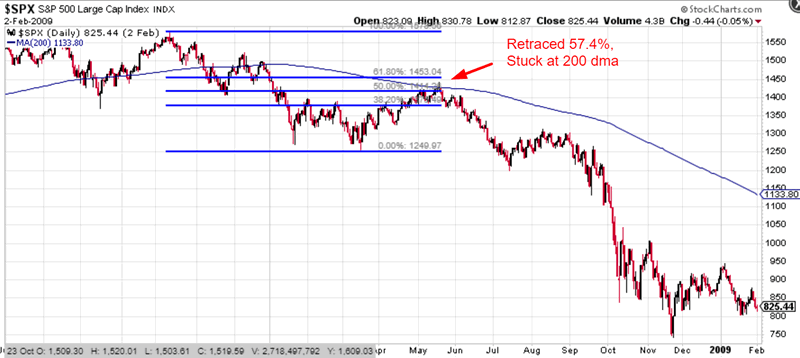
The stock market crashed and retraced 57% before falling even more in 2008. The S&P was at its 200 dma
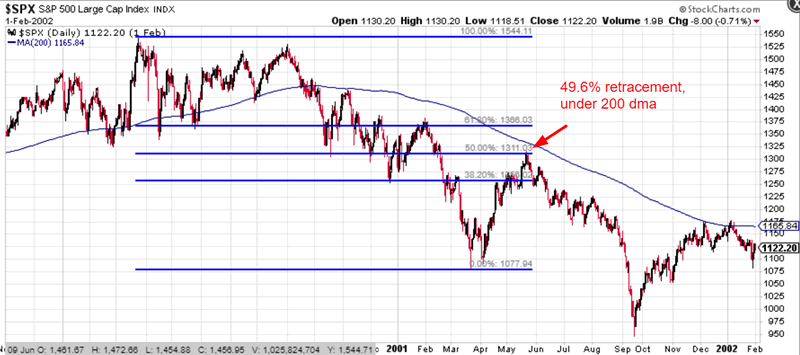
The stock market crashed and retraced 49% before falling even more in 2001. The S&P was at its 200 dma
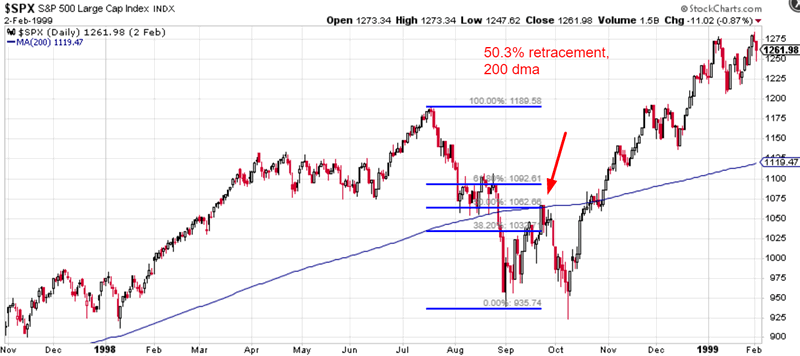
The stock market crashed and retraced 50% before retesting in 1998. The S&P was at its 200 dma
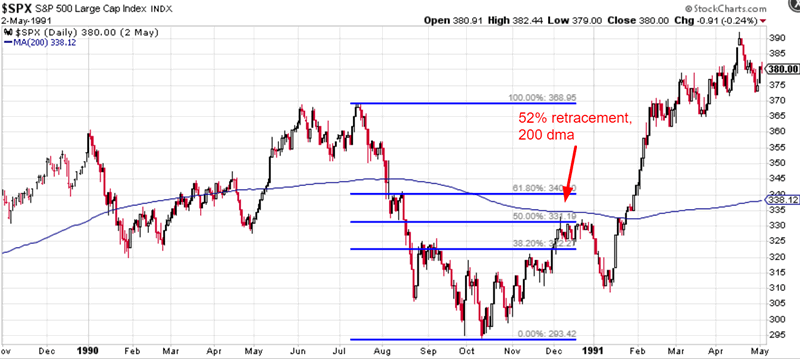
The stock market crashed and retraced 52% before making a pullback in 1990. The S&P was at its 200 dma
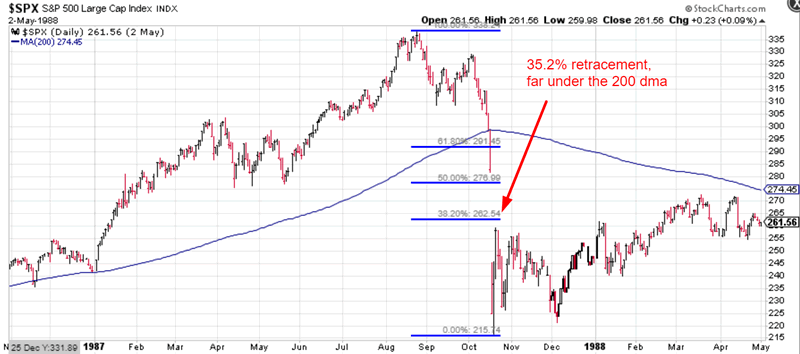
The stock market crashed and retraced 35.2% before retesting in 1987. The S&P was far under its 200 dma
*This case doesn’t really apply to today. The retracement was very shallow (35.2%) because the crash was so massive in 1987. So naturally the retracement would be shallow in terms of fibonacci retracements, even though the S&P had rallied a lot in just 2 days
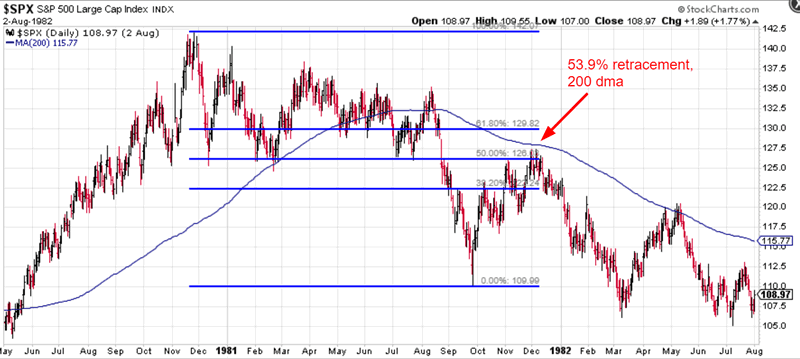
The stock market crashed and retraced 53% before falling to new lows in 1982. The S&P was at its 200 dma
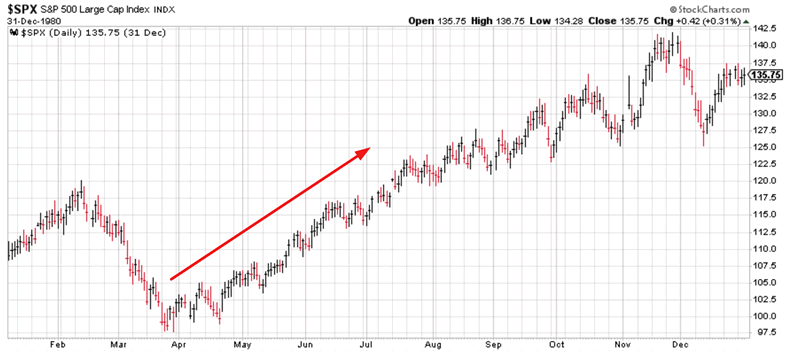
The S&P crashed and rallied straight to new all-time highs
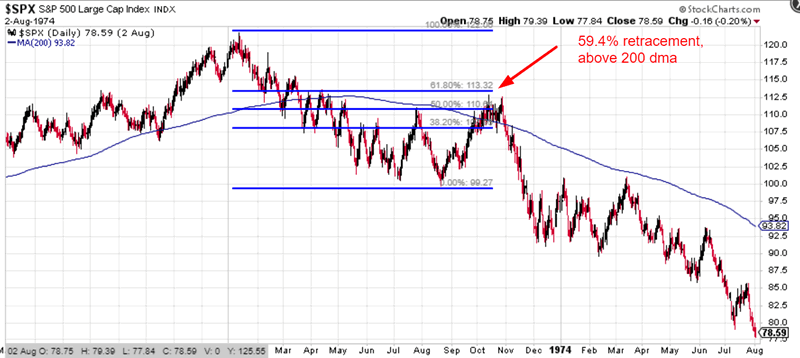
The stock market crashed and retraced 59% before falling to new lows in 1973. The S&P was above its 200 dma
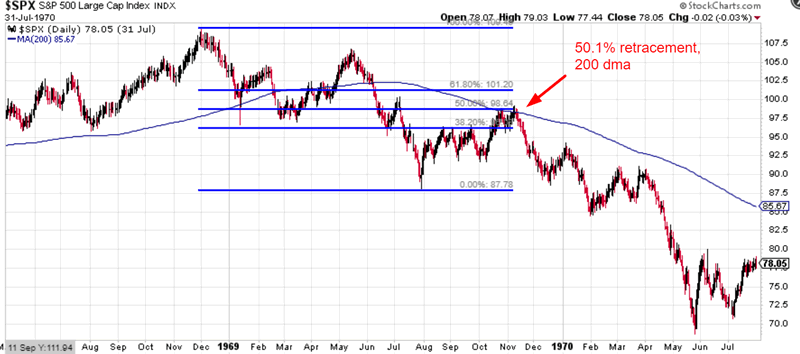
The stock market crashed and retraced 50% before falling to new lows in 1969. The S&P was at its 200 dma
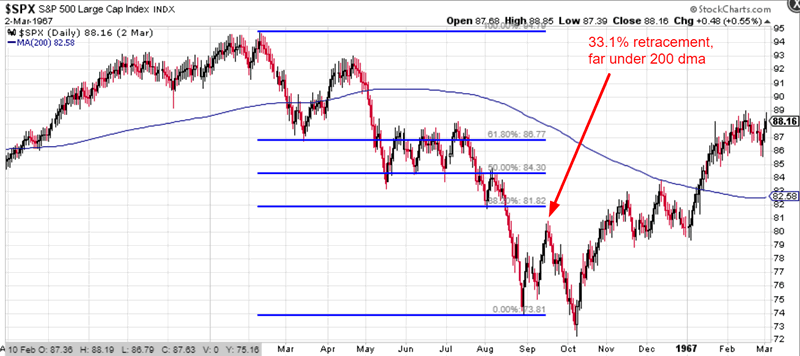
The stock market crashed and retraced 33% before retesting in 1967. The S&P was far under its 200 dma
*This case doesn’t really apply to today. The retracement was very shallow (33%) because the crash was massive in 1966. So naturally the retracement would be shallow in terms of fibonacci retracements, even though the S&P had rallied a lot in absolute % terms
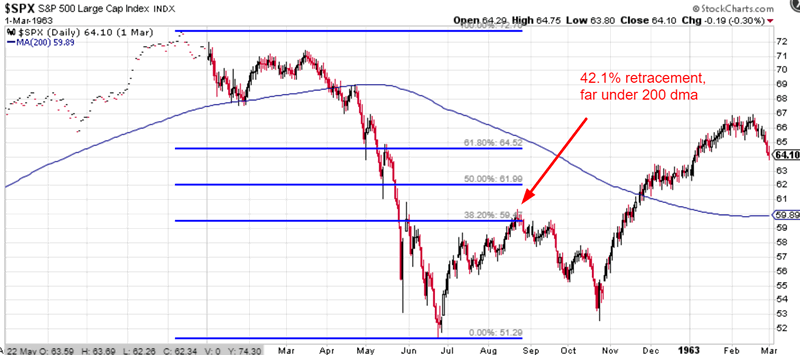
The stock market crashed and retraced 42% before retesting in 1962. The S&P was far under its 200 dma
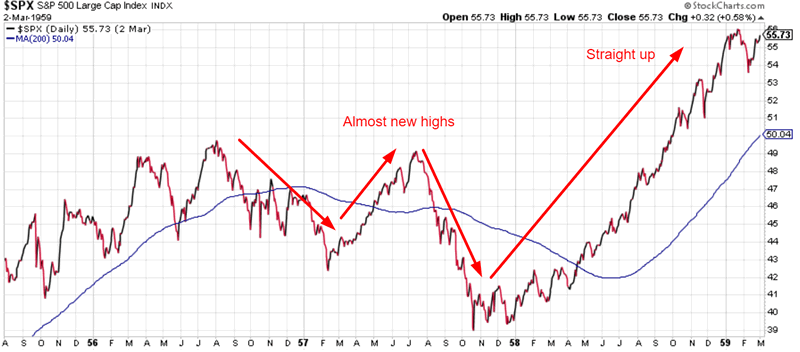
The stock market crashed, rallied to almost a new high, crashed even more, and then rallied straight to new all-time highs.
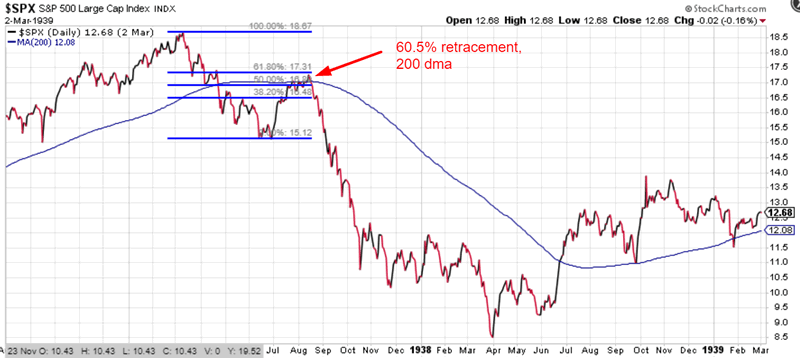
The stock market crashed and retraced 60% before falling to new lows in 1937. The S&P was at its 200 dma
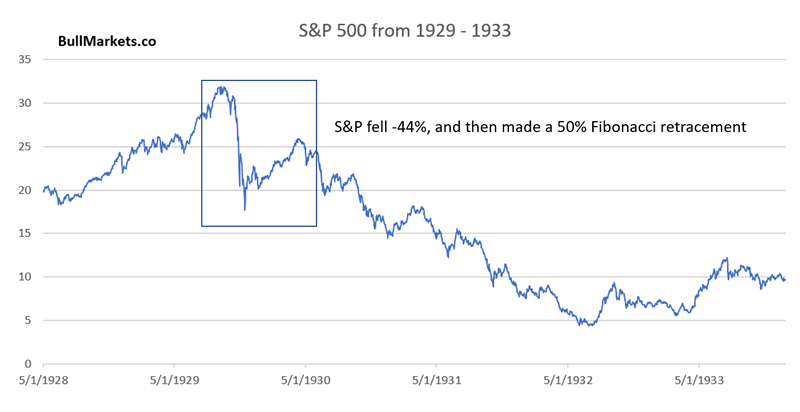
The stock market crashed and retraced 50% before falling to new lows in 1930.
*This case doesn’t apply to today, as the preceding crash in 1929 was massive compared to the stock market’s crash in Q4 2018
Conclusion:
- Most of these “crash and rally” patterns stall at the 50% retracement level or 200 day moving average
- It is not impossible for the S&P to retrace 60% before making a pullback/retest. This happened in 1937 and 1973
- It is not impossible for the S&P to rally straight to new all-time highs. This happened in 1980. (The context back then was very different from today. The 1980 case occurred after an economic recession. Post-recession rallies are always extremely fierce, and often don’t have any pullback/retest. There is no recession today, so the context is different)
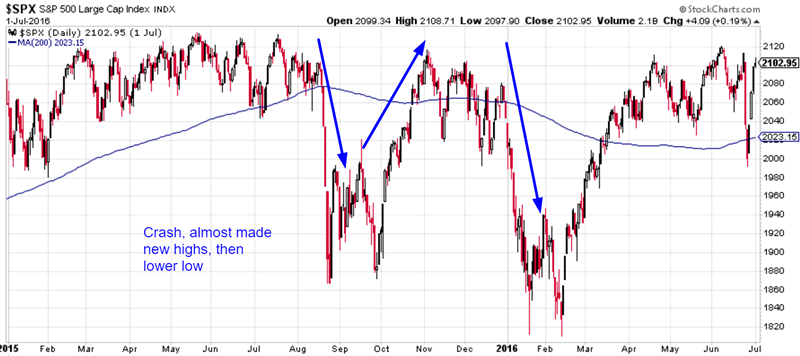
- It is not impossible for the S&P to rally to almost a new all-time high before making a pullback/retest. This happened in 1957, and to a lesser extent 2015-2016
So what is the point?
“Crash, rally, pullback/retest” patterns come in all shapes and sizes.
Most of the pullback/retests happen at the 50% retracement level, a few of them occur only when the S&P is near all-time highs. Only 1 of them never saw a pullback/retest, and that case (1980) was very different from today.
Biggest problem
We’ve already looked at chart patterns. The problem with chart patterns is that they can “look” bullish or bearish, depending on what the viewer already believes. The human eye is conditioned to see what it wants to see when staring at a chart. That is why we use trading models. Objective > subjective
The biggest problem right now for the stock market isn’t the “crash, rally, retest” pattern.
The biggest problem is:
The longer the stock market remains in a downtrend while macro doesn’t improve, the more trouble long term bulls are in.
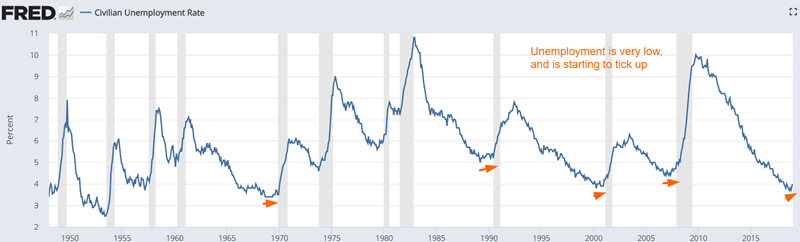
The Unemployment Rate is very low, but is starting to tick up. This may be temporarily due to the government shutdown. But if it persists for a few more months, long term bulls really need to watch out.
Meanwhile, the S&P remains below its 1 year moving average.
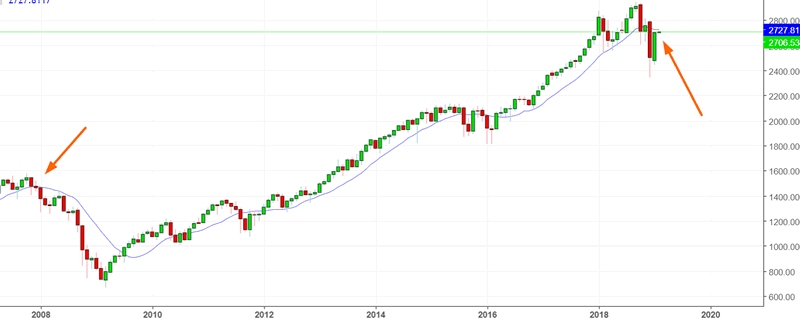
The last time this happened was at the start of the 2007-2009 bear market. But of course, “the last time this happened was 2008” doesn’t mean anything. We need to look at ALL the historical cases to draw a more accurate conclusion, instead of only looking at the bearish cases.
Here’s every single time the S&P was below its 12 month moving average for 2 consecutive months, while the Unemployment Rate was above its 12 month moving average for 2 consecutive months.
*Data from 1950-present
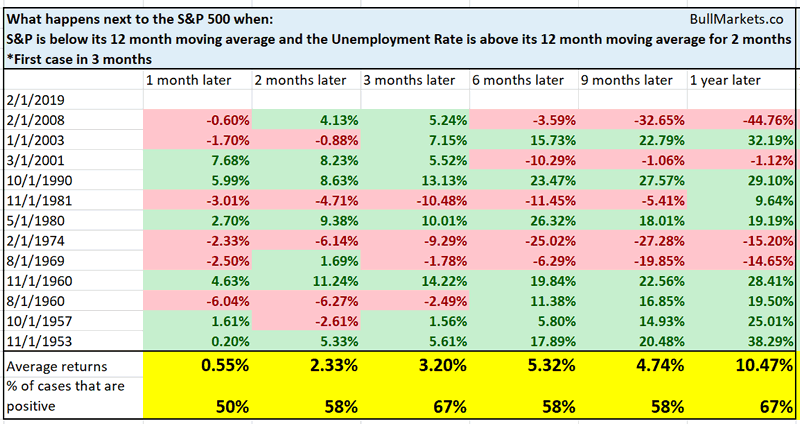
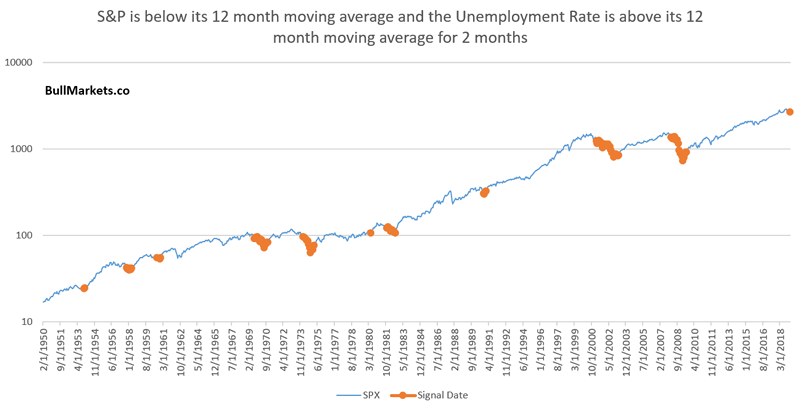
As you can see, this almost exclusively happened within the context of a bear market or recession.
VIX
Our market studies in December 2018 were consistently bullish. But now that the stock market has rallied significantly, our market studies are mixed. Few of them are as bullish as they used to be.
While the stock market rallied, VIX has finally closed below its 200 day moving average for the first time since early-October 2018, when the stock market crash began.
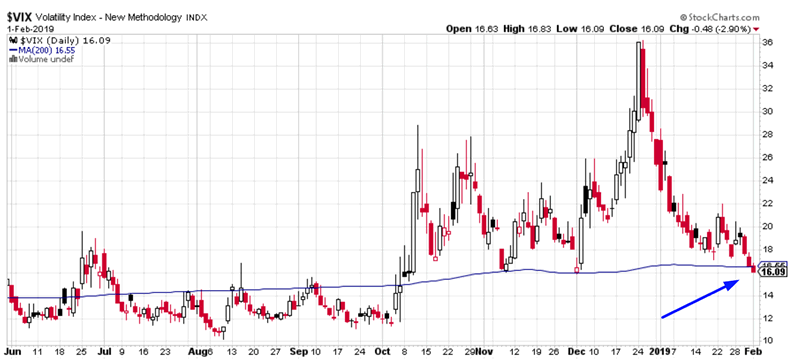
Here’s what happens next to the S&P when VIX closes below its 200 dma for the first time in 3 months.
*Data from 1990-present
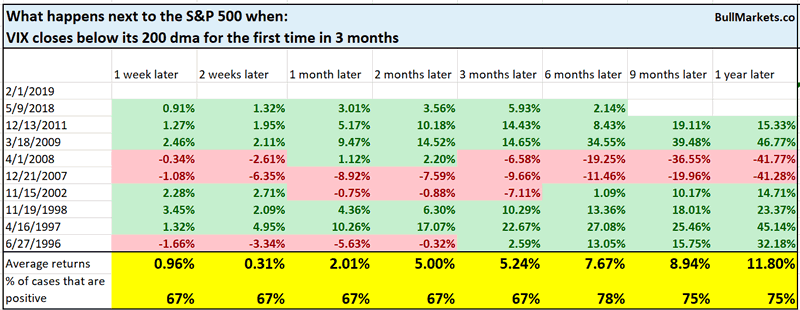
As you can see, the stock market’s forward returns are mostly random.
But what about VIX itself?
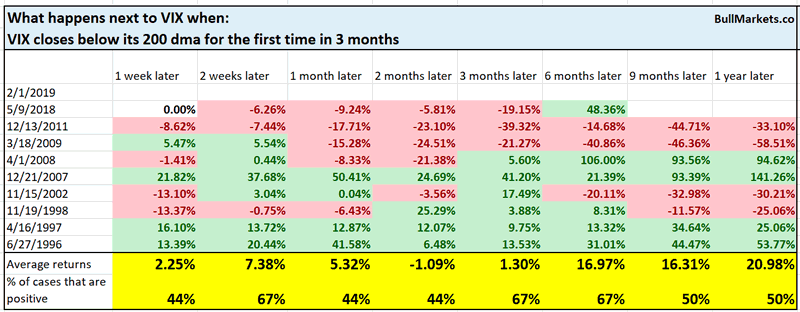
As you can see, VIX tends to rise 2 weeks later and 3-6 months later.
Macro Context
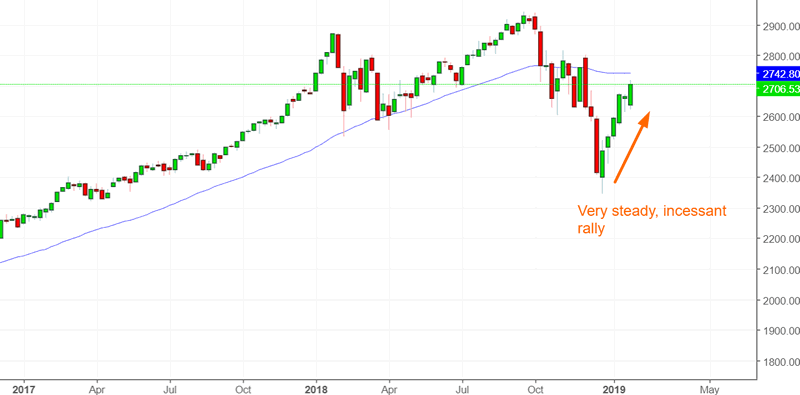
Strong rally
The stock market’s recent rally has been very strong and incessant.
It has gone up 5 of the past 6 weeks, while still under its 40 weekly moving average (i.e. 200 day moving average).
Here’s what happens next to the S&P when it goes up at least 5 of the past 6 weeks, gained more than 10%, and is still under its 40 weekly moving average
*Data from 1950-present
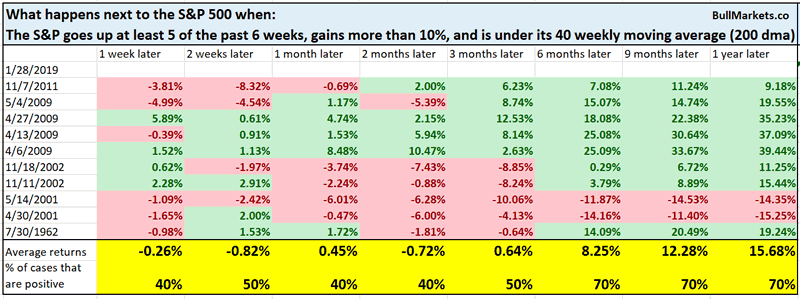
Once again, you can see that most of the “crash & rally” cases are followed by a pullback/retest
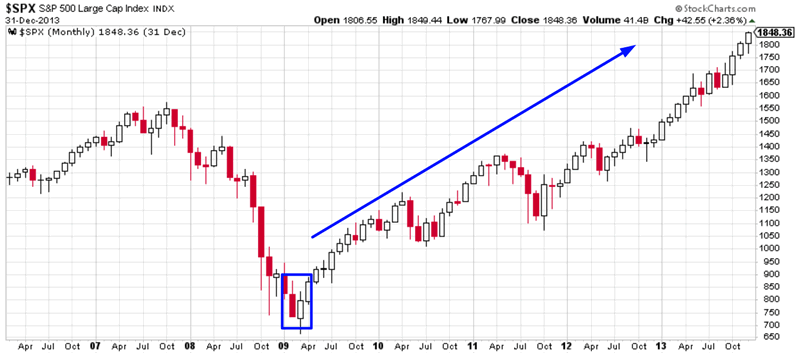
The only historical case that went straight up was 2009, after the S&P crashed more than 50%.
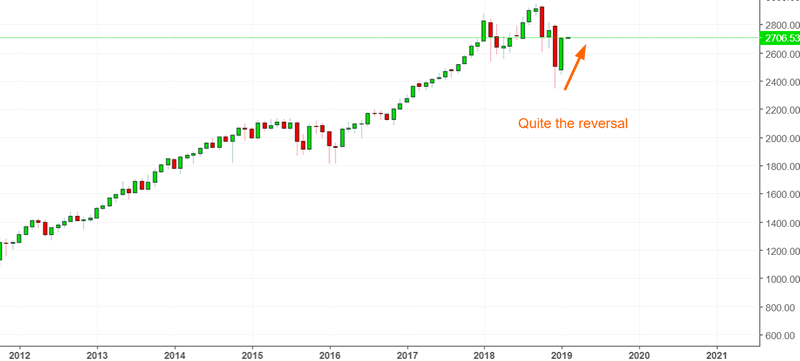
Quite the reversal
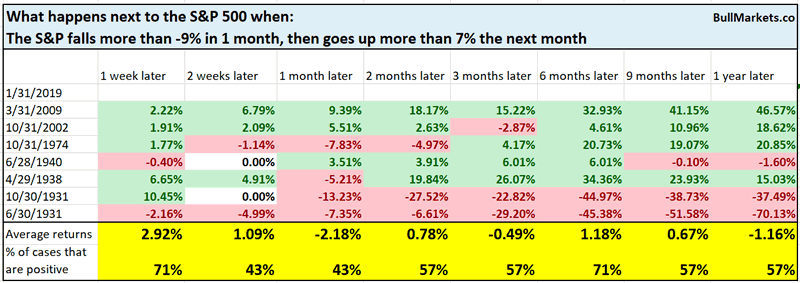
And lastly, this has been quite the 2 month reversal. The S&P fell more than -9% in December and then gained more than +7% in January
This kind of 2 month reversal has only happened 3 other times since 1950
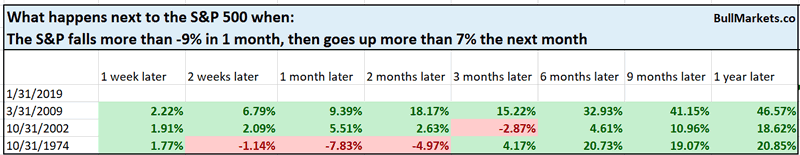
All 3 of these historical cases happened at the end of massive 50%+ bear markets.
The context is clearly from today. In each of these historical cases, the S&P fell more than -50%. In Q4 2018, the S&P fell less than -20%
Let’s expand the sample size to data from 1900-present
Here, you can see that the long term returns are less positive. This happens at the end of bear markets and in the middle of bear markets too.
Click here for yesterday’s market study
Conclusion
Here is our discretionary market outlook:
- The U.S. stock market’s long term risk:reward is no longer bullish. This doesn’t necessarily mean that the bull market is over. We’re merely talking about long term risk:reward. Long term risk:reward is more important than trying to predict exact tops and bottoms.
- The medium term direction (i.e. next 3-6 months) is neutral. Some market studies are medium term bullish while others are medium term bearish
- The stock market’s short term has a bearish lean due to the large probability of a pullback/retest. Focus on the medium-long term (and especially the long term) because the short term is extremely hard to predict.
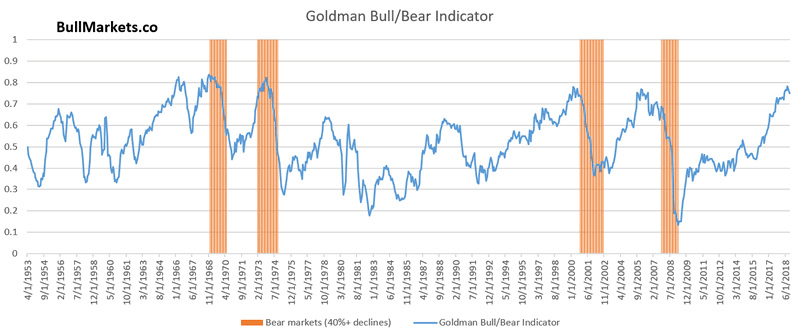
Goldman Sachs’ Bull/Bear Indicator demonstrates that while the bull market’s top isn’t necessarily in, risk:reward does favor long term bears.
Our discretionary outlook is not a reflection of how we’re trading the markets right now. We trade based on our clear, quantitative trading models, such as the Medium-Long Term Model.
Members can see exactly how we’re trading the U.S. stock market right now based on our trading models.
Click here for more market studies
By Troy Bombardia
I’m Troy Bombardia, the author behind BullMarkets.co. I used to run a hedge fund, but closed it due to a major health scare. I am now enjoying life and simply investing/trading my own account. I focus on long term performance and ignore short term performance.
Copyright 2018 © Troy Bombardia - All Rights Reserved
Disclaimer: The above is a matter of opinion provided for general information purposes only and is not intended as investment advice. Information and analysis above are derived from sources and utilising methods believed to be reliable, but we cannot accept responsibility for any losses you may incur as a result of this analysis. Individuals should consult with their personal financial advisors.
© 2005-2022 http://www.MarketOracle.co.uk - The Market Oracle is a FREE Daily Financial Markets Analysis & Forecasting online publication.