


SPY : More Volatility to Come Due to the Market’s Nature
Stock-Markets / Stock Markets 2019 Feb 11, 2019 - 07:22 AM GMT

 Our observations of the ETF, SPY, on the monthly chart have us expecting a spike in Volatility. The inherent bullish nature of the Market calls for advances (motive waves) as trends and pullback (corrective waves) as countertrend. To add to that nature, Elliott Wave Theory always suggests one of the 3 motive waves within an advance will be extended. The strongest advance is most often the 3rd wave. SPY has traced out a very strong move since lows of 2009. Due to that extension it’s hard to find technical support to call for another similar rally.
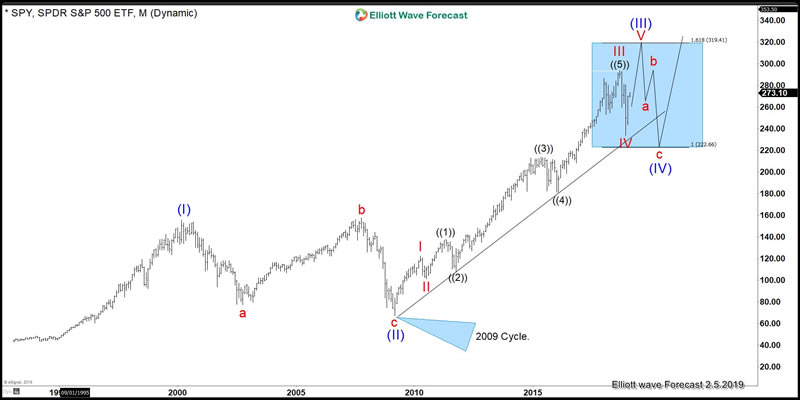
In the monthly chart of SPY below the early stages of the advance from 2009 show what can be an Elliott wave “nest” as labeled I-II in red, then ((1)) –((2)) in black. Nested labeling is quite common at the start of very powerful impulsive motive waves.
We have identified two characteristically similar paths for SPY going forward.
Path 1: The Index is still within the powerful wave (III) in blue.
Even though the chart shows the wave IV in red complete, we have yet to confirm with a subsequent new high. Therefore Wave IV in red could take various corrective forms. SPY could be in a double –three corrective structure if price action breaks below the December 2018 lows. So we must account for that possibility until we see new highs coupled with a hold of the December lows. This alternative scenario would push red wave IV lower than the current labeling. A third alternative is that of a triangle forming for the wave IV. Review the places where a triangle may form here. A result of the triangle path would suggest a minimum upside target to be the inverse 123.6% extension of wave IV. This measurement would take time to develop as we would need the confirmed completion of the triangle for a more precise measurement.
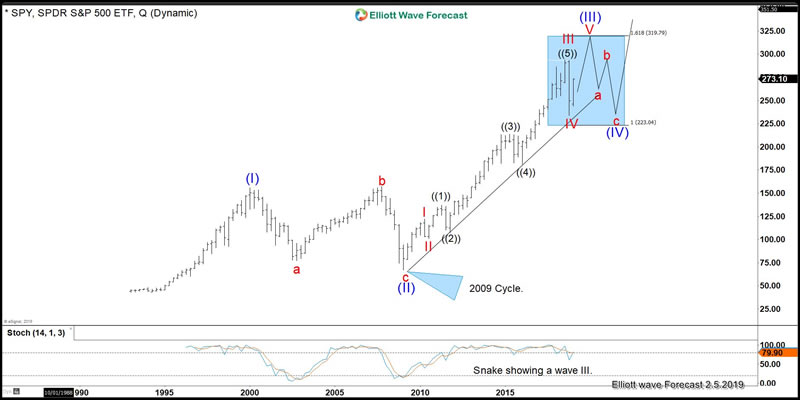
This continuation of wave (III) path is also supported by the idea that the 1.618 extension of wave (I) measured from the bottom of wave (II) has not yet been reached at 315.00. It is common to expect a wave (III) to end near that extension measurement. Another reason that supports this path is the idea that the Stochastic is “snaking” on the monthly chart. This is another common proprietary observation typical of a wave (III) still in progress. This is due to a third wave’s powerful momentum. Furthermore, the cycle from 2009 is holding the channel. The following picture is showing the Quarterly chart with the “snake” in clear in the stochastic indicator.
Path 2: The SPY ended the cycle and wave (III) in blue from the 2009 low.
This scenario would lead SPY to correct in a series of 3, 7, or 11 swings lower. Otherwise stated we would already be within the wave (IV) Blue. In this path it is critical that prices remain below the 2018 peak. In the near term path 2 would suggest not only a hold of last year’s peak but a turn back lower by the weeks of 2/13/2019-2/18/2019 or 2/25/2019-3/5/2019.This path simply suggest another leg lower before a turn back higher.
Path 2 is supported by the idea that stocks like $APPL and $FB have ended their largest degree cycles at their respective all-time highs. This view is very similar to the 2009 cycle. The correlation between both paths 1 and 2 suggest a third wave of some degree has already ended. The main evidence lies in the strength of the advance from 2009’s low. Time will tell which Path will manifest within the market going forward. No matter the path we will be ready for the volatility with the help of the Elliott Wave Theory. No matter how volatile the market gets the overall Right Side in 2019 will be to find and buy the coming dip.
By EWFEric
https://elliottwave-forecast.com
ElliottWave-Forecast has built its reputation on accurate technical analysis and a winning attitude. By successfully incorporating the Elliott Wave Theory with Market Correlation, Cycles, Proprietary Pivot System, we provide precise forecasts with up-to-date analysis for 52 instruments including Forex majors & crosses, Commodities and a number of Equity Indices from around the World. Our clients also have immediate access to our proprietary Actionable Trade Setups, Market Overview, 1 Hour, 4 Hour, Daily & Weekly Wave Counts. Weekend Webinar, Live Screen Sharing Sessions, Daily Technical Videos, Elliott Wave Setup .
Copyright © 2019 ElliottWave-Forecast - All Rights Reserved Disclaimer: The above is a matter of opinion provided for general information purposes only and is not intended as investment advice. Information and analysis above are derived from sources and utilising methods believed to be reliable, but we cannot accept responsibility for any losses you may incur as a result of this analysis. Individuals should consult with their personal financial advisors.
© 2005-2022 http://www.MarketOracle.co.uk - The Market Oracle is a FREE Daily Financial Markets Analysis & Forecasting online publication.