


Strategy Session - How This Stocks Bear Market Fits in With Markets of the Past
Stock-Markets / Stock Markets 2019 Feb 14, 2019 - 01:52 PM GMTBy: Plunger

 Question: Plunger you keep insisting that we are in a bear market. Really? The averages have done nothing but go straight up since December 24th. At this rate we will be at new highs within a month. I thought prices go down in a bear market! That’s not happening.
Answer: The most reliable method of forecasting the eventual outcome of the market over the past 118 years has been Dow’s Theory. It has withstood the test of time. It is not a short term predictor, instead it has been likened to a weather barometer. An instrument that forecasts changes in business conditions and market cycles. It is not useful in predicting short term fluctuations just like a weather barometer shouldn’t be used to forecast the amount of rain or snow to fall in an upcoming storm.
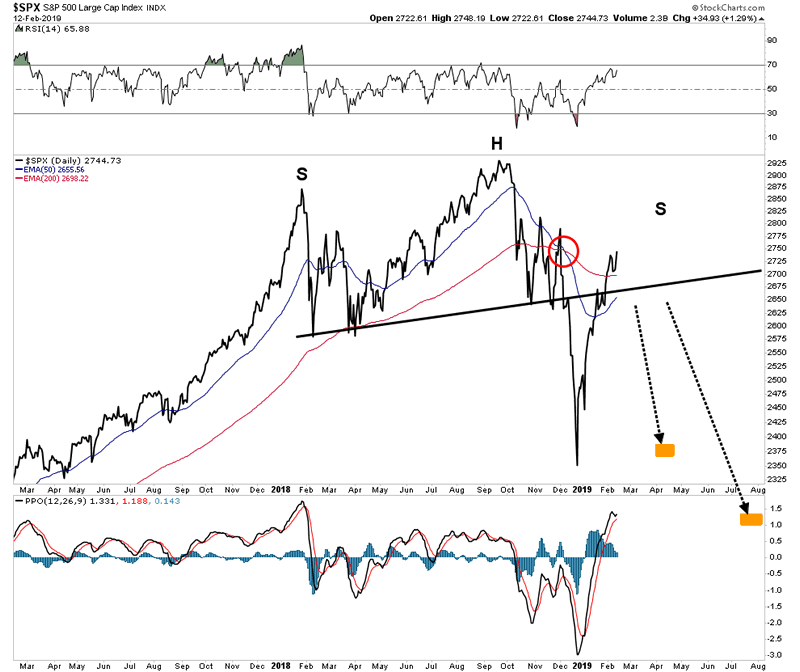
It is my contention that if one gets the big cycles right he has enabled the basic setup for success in the market. If you don’t understand the cycle and position yourself wrong in it, good luck trying to make money. So we stick to Dow Theory, it has proven to work in the past under all market conditions. What it says now is a bear market was triggered on December 14th 2019 which began on October 3rd 2019. The present 8 week rally is a secondary reaction which remains uncorrected. All rallies are corrected. We must be patient and observe the price action of the upcoming correction. In order to reverse the downward primary trend, the Dow and Transports must complete a downside correction of the existing rally then rally back above today’s present reaction high.
It is my contention that if one gets the big cycles right he has enabled the basic setup for success in the market. If you don’t understand the cycle and position yourself wrong in it, good luck trying to make money. So we stick to Dow Theory, it has proven to work in the past under all market conditions. What it says now is a bear market was triggered on December 14th 2019 which began on October 3rd 2019. The present 8 week rally is a secondary reaction which remains uncorrected. All rallies are corrected. We must be patient and observe the price action of the upcoming correction. In order to reverse the downward primary trend, the Dow and Transports must complete a downside correction of the existing rally then rally back above today’s present reaction high.
That’s the bottom line, The bear market began on October 3rd, the initial decline was 19% and now that move is being corrected in a V-shaped secondary reaction. It is generally not advised to try to trade against the primary trend, although nimble traders may attempt it. Obviously the present 8 week rally could be considered as one of those occasions.
I would like to review the four major bear markets over the past 50 years and use them to guide us in developing a strategy going forward. The conclusions offer us insight in developing our present strategy going forward.
DL Global– All the world’s stock markets
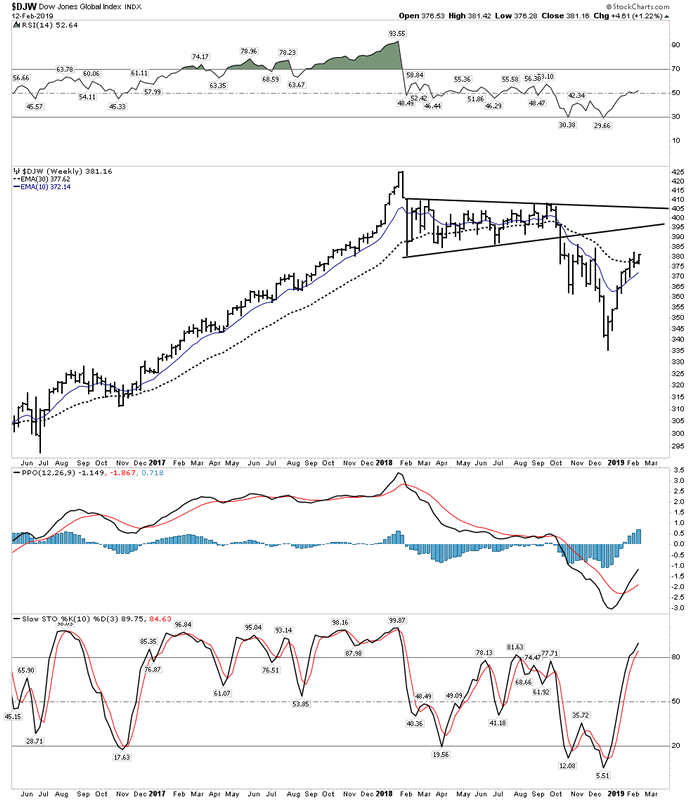
The above chart shows us how all of the world’s markets are locked in a downtrend. Despite the rip roaring rally of the past 2 months it looks like the top is in.
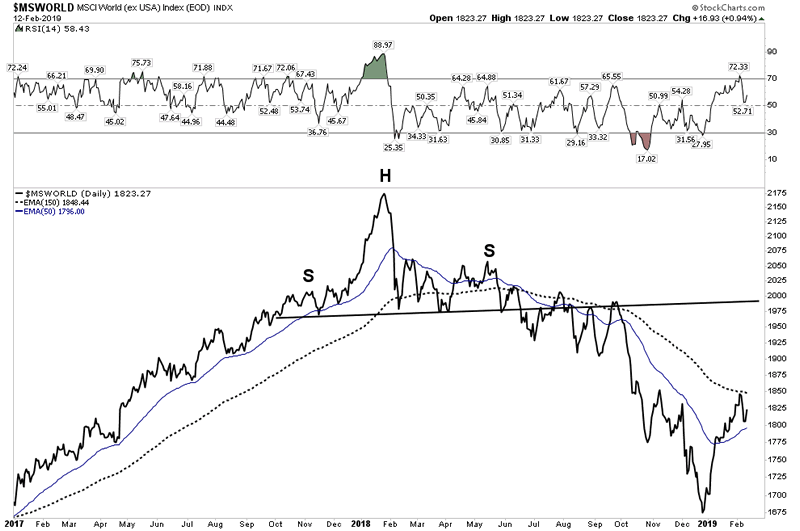
MS World- All markets minus the USA.
These two broad based indexes should bring one back to reality. It’s not likely the USA will go it alone if the rest of the world is in a down trend.
The Analogy of the 1937 Bear Market
I have mentioned this before, but let’s review. Of all the bull and bear markets I am aware of the closest relative to the past 10 years is the market of the 1930’s. It has so many similarities to the past 10 years that it may offer a guide to our market going forward.
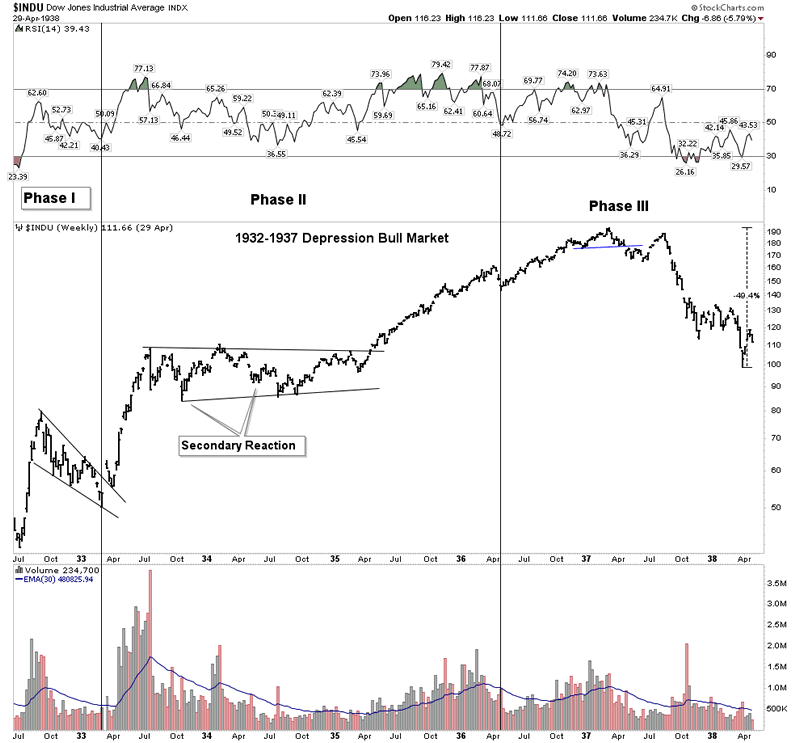
The big tell to this bull market from 1932-1937 is its odd-ball volume pattern. It is not normal for a bull market. A normal bull market shows volume building throughout the length of the uptrend. This is because as the price rises it attracts more money flow. Above we see volume as erratic, but the blue average volume trend line shows it steadily declining over time. The narrative back in the 1930’s was that the government was spending us out of a depression. This was simply a form of financial engineering.
2009-2018 Bull Market
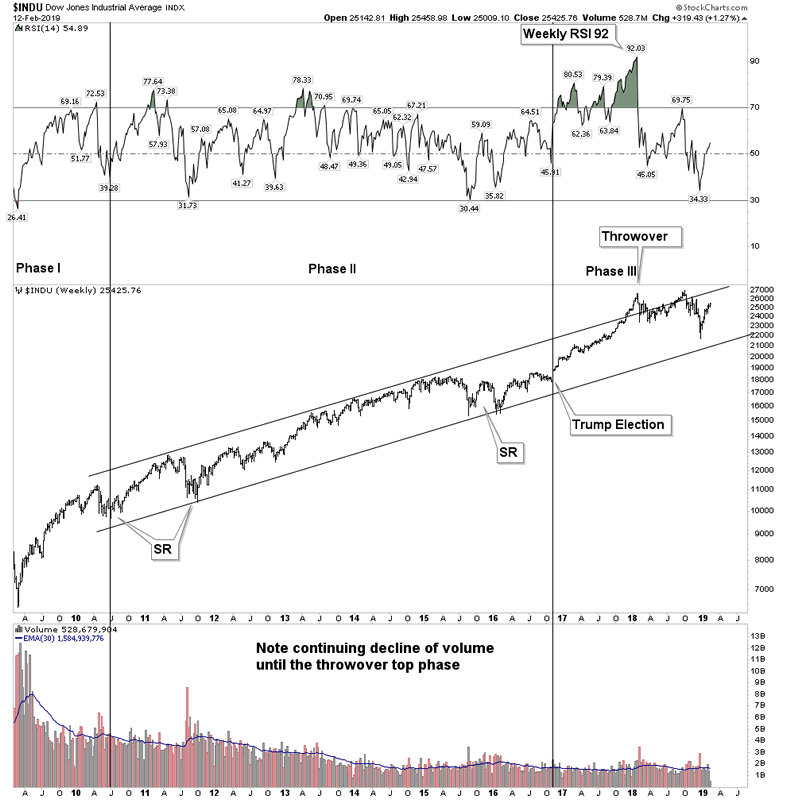
The volume trend over the past 10 years in this bull market is even more blatant. The main driving force behind the bull over the past 10 years has been stock buybacks… pure financial engineering. Realize what’s been going on here, stock buybacks remove stock from the market and strip mine corporate equity from balance sheets. Stated differently, they have been removing liquidity from the market… keep that thought in your head for later.
The public never really came into this bull market until the very end. It wasn’t until the final push up from July 2017 onward that the retail public finally became confident and began piling into the market. This can be seen in the volume since activity began to build in the second half of 2017 despite corporations removing stock from the float. This is classic end game action for the public to finally embrace the market right at the end.
Future Ramifications
It is my analysis that both the 1930’s and 2010’s bull market advanced due to financial engineering and they will also have similar resolutions to the downside. This is because financial engineering drains liquidity out of the market. In the 1930’s when inevitable top was put in, there were no layers of support to resist the fall. The collapse was catastrophic and rapid.
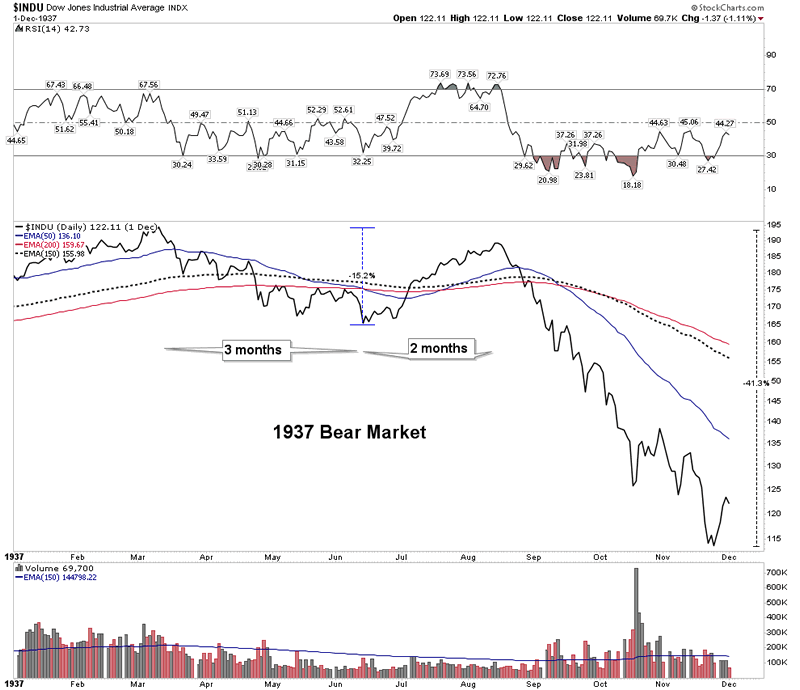
Above we see the initial wave down in the first year of the bear market in 1937. The removal of liquidity led to a relentless, take no prisoners, decline.
Also observe the time line prior to the main decline. The initial decline lasted 3 months followed by a 2 month retracement of almost all of the decline. Look familiar? The present bear market declined from Oct 3rd to December 24th. (almost 3 months) and the retracement up is now approaching 2 months. So on a time line you can see it’s a perfect match of today’s market. Also note how the volume trailed off throughout the upward retracement, just like today.
Bear Market Length Studies
Research averaging 20 prior large sized V-shaped declines after a bear-cross of the 50/200 EMA show that the present bounce is actually normal and it should lead to a decline back to either the previous low or a lower low sometime over the next few months.
The average of the 20 cases projects an S&P level of 2332 by April 8th.
The median of the 20 cases projects the S&P level of 2244 by July 4th.
The below chart shows the average and median outcome:
So this present rally still appears to have a bit more upside remaining, however once over it should renew itself to the downside.
Bear Market Shorting Opportunities
Shorting downtrends is difficult at best. By reviewing the past 4 major bear markets over the past 50 years we actually see relatively few periods where the trend down moved with enough speed to make it worth it. Keep in mind that if one is using leveraged vehicles such as 2 or 3X inverse ETFs or put options there is time premium working against you. So the idea of just taking a short position and waiting for the entire downtrend to do its work is not an advisable strategy. One really wants to be short only during the rapid downward part of the move. I have labeled these periods as bear boxes.
Avoiding BMR’s
The charts below show that avoiding BMR’s is really essential when trading the downside. A BMR not only takes ones profit away in quick order, but it wrecks ones psychological state. It simply traumatizes a trader when he holds through a full sized BMR. Therefore I have split up the tradable downside periods into light colored bear boxes showing the profitable shorting periods.
1973-1974
This was a brutal bear market that proved to be relentless once it got underway. But in retrospect, it had only 3 accelerated downside bear boxes. Look at the duration, 1 month, 3.5 months, 1 month. It really only “paid” to be short during these limited periods despite the massive total decline.
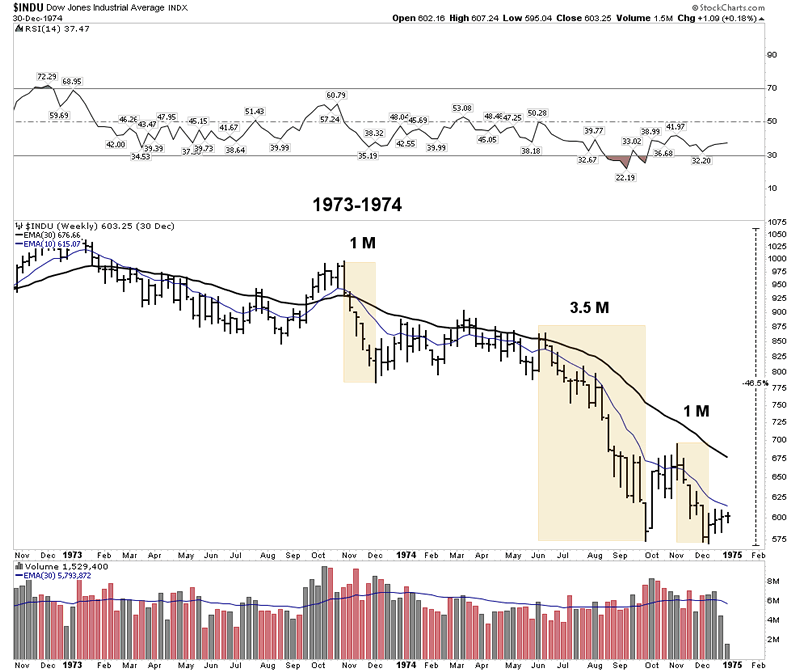
Also note what will soon be seen as a recurring theme; the bear boxes don’t come until the second half of the bear market. The lesson being that it is best to just steer clear of shorting until the bear is well underway.
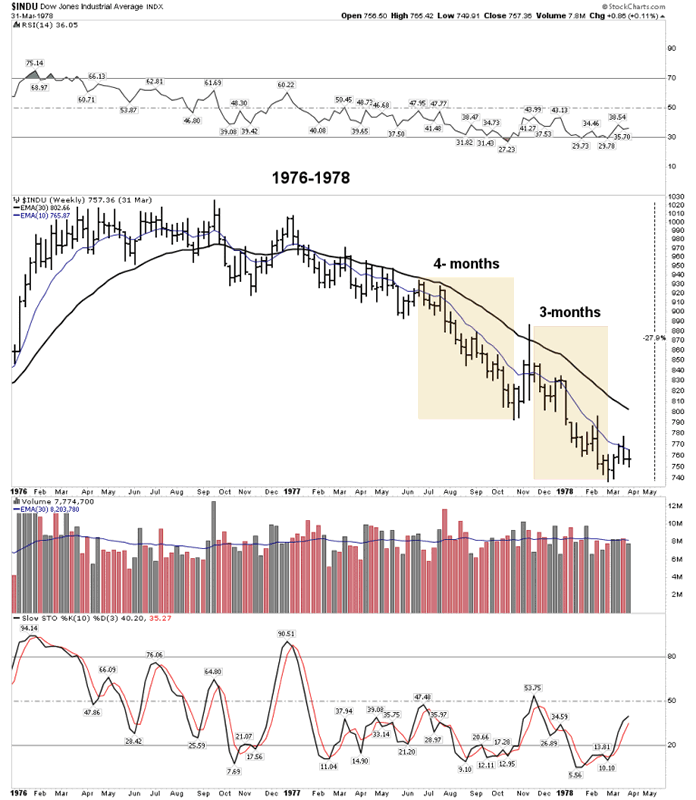
1976-1978
This was a much milder bear market lasting 2 years and down 27%. But keep in mind inflation was raging so the real declines were actually larger. Here we see two bear market boxes, again coming in the second half of the bear.
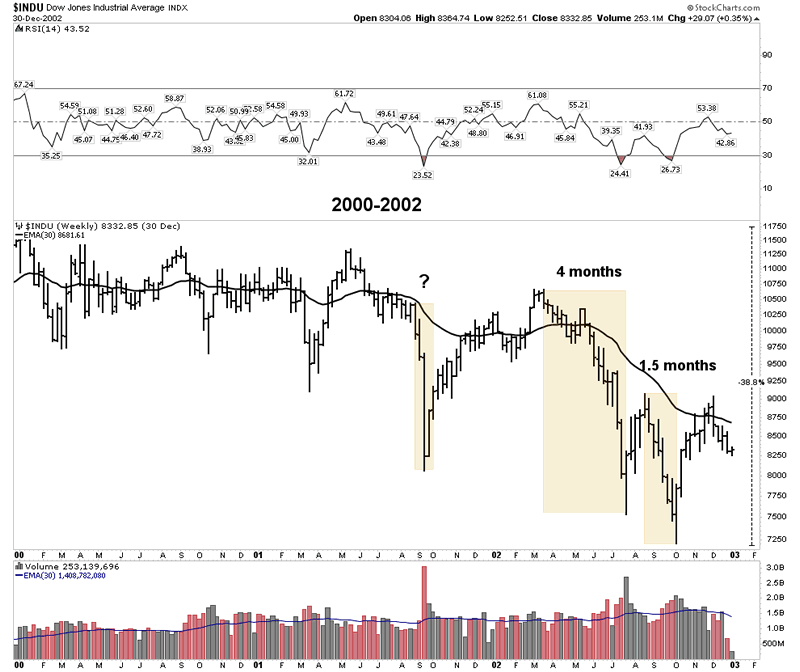
2000-2002
This bear came after the Dot-Com mania and was particularly brutal for the tech sector, but proved to be run of the mill for the market as a whole. The 911 decline is interesting as it actually started in August 2001 so if you were short you scored big off of the national tragedy, but it came as a surprise. But note how the market quickly recovered prior highs, so it was somewhat of an artificial decline. The real declines didn’t come until the last 2/3rds of the bear market in two boxes 4 & 1.5 months long.
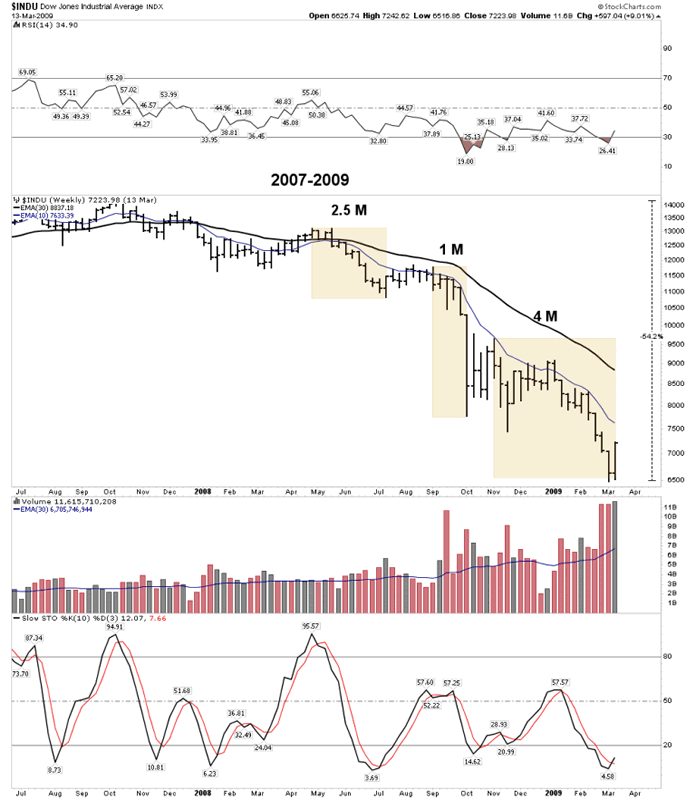
2007-2009
For short sellers this was the money maker if you could avoid the BMR’s. Three bear boxes gave lots of opportunity to cash in, but look again how they didn’t come until the second half of the bear market
Conclusions
A few stark conclusions really jump out at you after reviewing these charts. The first is the realization that over a 50 year period there were only 24 months where the market was in a bear box. That is only 24 months where it was worth the aggravation to short the market while in a known bear market.
Next is the observation that these boxes only come in the second half of the bear.
This is what Stan Druckenmiller has observed. He has made most of his big scores on the downside and he has said that he waits through the first few declines then piles on once the declines become developed.
Note that in all of these bear markets the bear boxes came well past a year into the bear market.
So where are we today? I would suggest that using the 2007-2009 bear market as a reference we are somewhere in early 2008. We have had the first shot down, but the big declines don’t come until maybe later on in 2019 or into 2020. One could try and trade the upcoming decline over the next few months, but realize it’s probably not the big move. Don’t spend all of your mental capital on the next move, instead prepare yourself for the big one.
All the best
By Plunger
FREE TRIAL - http://rambus1.com/?page_id=10
© 2019 Copyright Rambus- All Rights Reserved
Disclaimer: The above is a matter of opinion provided for general information purposes only and is not intended as investment advice. Information and analysis above are derived from sources and utilising methods believed to be reliable, but we cannot accept responsibility for any losses you may incur as a result of this analysis. Individuals should consult with their personal financial advisors.
© 2005-2022 http://www.MarketOracle.co.uk - The Market Oracle is a FREE Daily Financial Markets Analysis & Forecasting online publication.