


Retail Sales Crash! It’s 2008 All Over Again for Stock Market and Economy!
Stock-Markets / Stock Markets 2019 Feb 15, 2019 - 05:38 PM GMTBy: Troy_Bombardia

 On a slow moving day for the U.S. stock market, today’s big news is that “Retail Sales crashed, just like in 2008/2009!!!”. Financial media jumped all over this – nothing sells like bad news.
Go here to understand our fundamentals-driven long term outlook.
Let’s determine the stock market’s most probable medium term direction by objectively quantifying technical analysis. For reference, here’s the random probability of the U.S. stock market going up on any given day.

*Probability ≠ certainty. Past performance ≠ future performance. But if you don’t use the past as a guide, you are blindly “guessing” the future.
Retail Sales like 2008 and 2009?
When it comes to understanding economic data, look at the OVERALL TREND in the data and not individual month-to-month readings. Individual readings are incredibly noisy, and big swings often come from statistical errors.
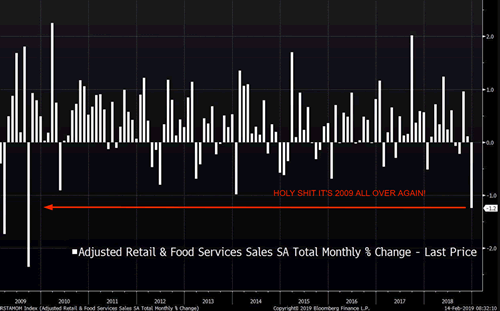
Below is a chart for the month-to-month change in Retail Sales.
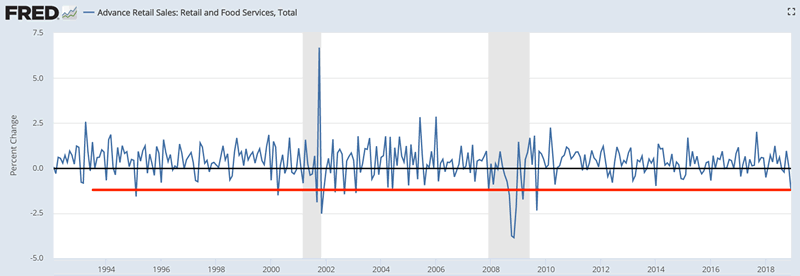
You can see that while December 2018’s “plunge” was the biggest since 2009, such “crashes” occurred in 1995 and 2002-2004 (economic expansion years). Individual readings mean nothing, unless put into context.
Here’s a look at the overall trend in the data.
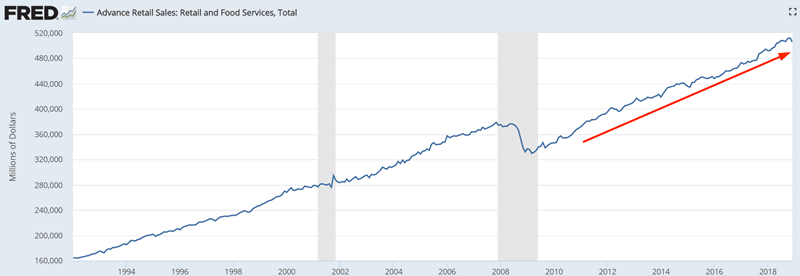
Retail Sales made a high in November 2018 and fell in December 2018. Overall, the trend is still pointing upwards.
Here’s evey single month in which Retail Sales fell more than -1.2%, and what happened next to the S&P

The real problem
While everyone was focusing on Retail Sales today, the more important news was today’s Initial Claims reading. It seems that Initial Claims has bottomed, and will probably start to trend higher over the next few months.
*Initial Claims is a key labor markets indicator
The 4 week moving average of Initial Claims made a 52 week high today (1 year high).
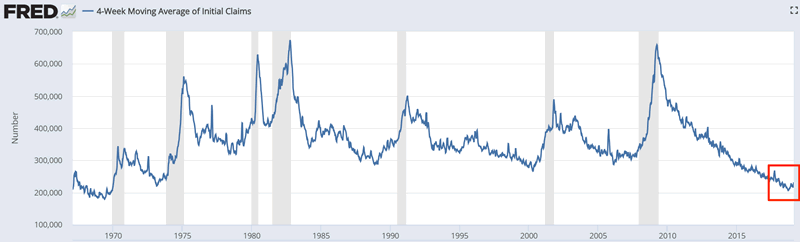
Combined with an Unemployment Rate that’s ticking up, this late-cycle development is not good for stocks.
Here’s what happens next to the S&P when Initial Claims’ 4 week average makes a 1 year highs, while Unemployment is above its 12 month moving average and below 5% (late-cycle).
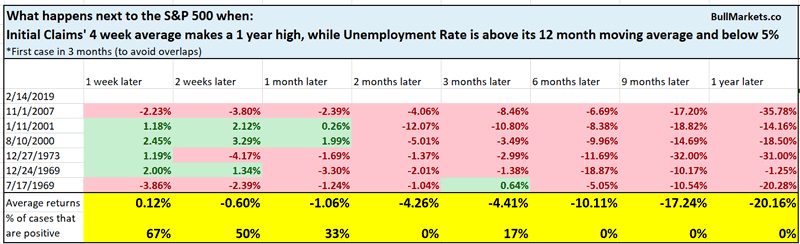
As you can see, all of these were bear market cases.
Personally, I would wait a little to see if the bearish trend in Initial Claims continues. Not necessarily long term bearish now, but something to watch out for over the next few months.
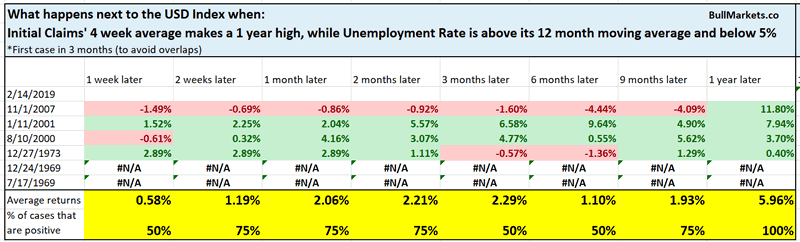
Meanwhile, all of these historical cases were good for the U.S. Dollar. The U.S. Dollar tends to do well in an equities bear market. (Yesterday I outlined a bullish case for the USD).
No new highs
The markets are influenced by self-reinforcing behavior. This is the concept behind momentum, a well researched topic among financial professionals:
An object that’s in motion tends to stay in motion
There’s a flip side to this phenomenon that I have observed.
In a late-cycle environment, the longer it takes for the market to make new highs, the more and more market participants doubt the bull market. Their doubt becomes self-fulfilling.
Think about the logic. Towards the end of a bull market, many investors and traders know that the market is late-cycle. Hence, everyone is playing what Warren Buffett calls the Greater Fools game: buying stocks that will “eventually” fall, but hoping that the bull market will last long enough so that they can sell their stocks to a greater fool.
And the longer the stock market doesn’t make new highs, the more and more these investors start to think “crap, maybe I am the greater fool”. In a late-cycle environment, the more the market can’t make new highs, the more investment professionals step back. Their lack of buying can become self-fulfilling and kill the bull market.
The S&P has gone 100 days without making a new all time high, while unemployment is under 5% (late-cycle).

This is not bullish for stocks on any time frame
Financials and industrials
We use trading models to make buy and sell decisions. We use market statistics to help us formulate a discretionary market view. Market statistics let us backtest our hypothesis.
Over the past 18 days, financial stocks have gone nowhere while industrial stocks have surged.
Here’s XLF (financial sector ETF)

Here’s XLI (industrials ETF)
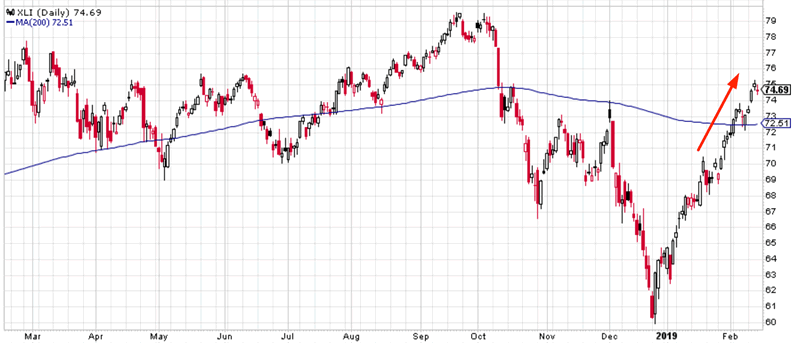
In my mind, this is a long term bearish sign for stocks. At the end of a bull market and economic expansion, industrials tend to outperform while financials underperform due to the slowing economy and flatness of the yield curve.
Am I right? Is this a bearish sign for the stock market?
Here’s what happens next to the S&P when XLI goes up more than 6% over the past 18 days, while XLF falls
*Data from 1998 – present

As you can see, this is a short term bearish sign for the stock market, but isn’t a consistently long term bearish sign. This happens at some bull market tops (e.g. 1999 and 2007), but also happens within bull markets (e.g. 2004, 2010, 2016).
This is also quite short term bearish for XLI.

And is also short term bearish for XLF

Small caps
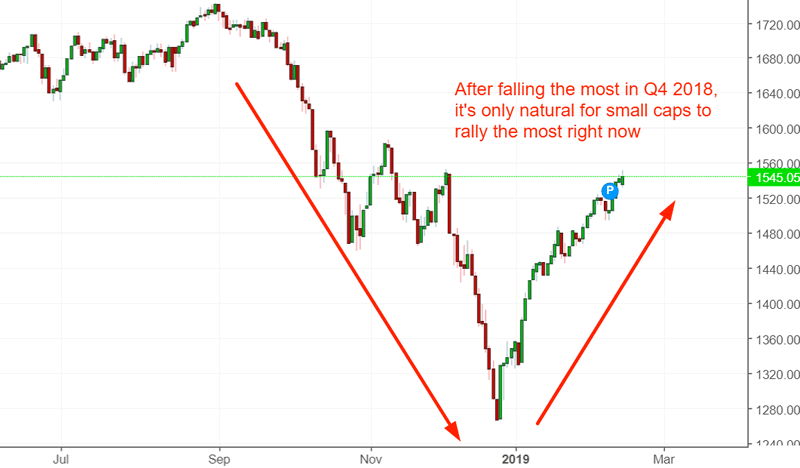
Several guests on CNBC have commented on small caps’ outperformance. Some see this outperformance as a bullish sign while others see it as a bearish sign. I see it mostly as an irrelevant sign – small caps are rallying the most right now simply because they fell the most in Q4 2018. Volatility and extremes go both ways.
Here’s the Russell 2000 (small caps index)
Nevertheless, let’s look at the data to see if my hypothesis is right.
Here’s what happens next to the S&P 500 when the Russell goes up more than 21% over the past 35 days, while the S&P goes up less than 17% (excluding overlapping signals).
*Data from 1987 – present
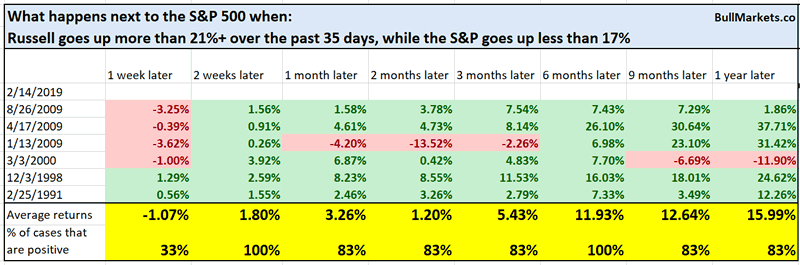
The sample size is small:
- 1991
- 1998
- 2000
- 2009
Not consistently bullish or bearish for the stock market.
Click here for yesterday’s market study
Conclusion
Here is our discretionary market outlook:
- The U.S. stock market’s long term risk:reward is no longer bullish. In a most optimstic scenario, the bull market probably has 1 year left. Long term risk:reward is more important than trying to predict exact tops and bottoms.
- The medium term direction (i.e. next 6 months) is neutral. Some market studies are medium term bullish while others are medium term bearish
- The stock market’s short term has a bearish lean due to the large probability of a pullback/retest. Focus on the medium-long term (and especially the long term) because the short term is extremely hard to predict.
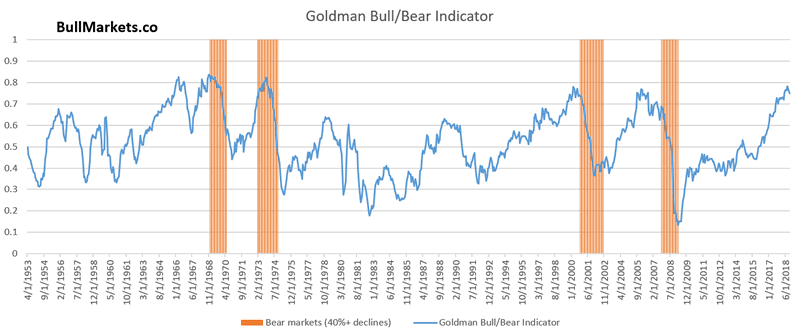
Goldman Sachs’ Bull/Bear Indicator demonstrates that while the bull market’s top isn’t necessarily in, risk:reward does favor long term bears.
Our discretionary outlook is not a reflection of how we’re trading the markets right now. We trade based on our clear, quantitative trading models, such as the Medium-Long Term Model.
Members can see exactly how we’re trading the U.S. stock market right now based on our trading models.
Click here for more market studies
By Troy Bombardia
I’m Troy Bombardia, the author behind BullMarkets.co. I used to run a hedge fund, but closed it due to a major health scare. I am now enjoying life and simply investing/trading my own account. I focus on long term performance and ignore short term performance.
Copyright 2019 © Troy Bombardia - All Rights Reserved
Disclaimer: The above is a matter of opinion provided for general information purposes only and is not intended as investment advice. Information and analysis above are derived from sources and utilising methods believed to be reliable, but we cannot accept responsibility for any losses you may incur as a result of this analysis. Individuals should consult with their personal financial advisors.
© 2005-2022 http://www.MarketOracle.co.uk - The Market Oracle is a FREE Daily Financial Markets Analysis & Forecasting online publication.