Iran's Death Spiral -- 40 Years And Counting
Politics / Iran Feb 17, 2019 - 04:54 PM GMTBy: Steve_H_Hanke
 Today, Supreme Leader Khamenei and the mullahs celebrated the 40th year of Iran’s Islamic Revolution. With the exception of the Revolutionary Guard and “the beards,” as the hard core have been dubbed, few in Iran have much to celebrate. In the economic sphere alone, Iranians have been in a forty-year death spiral. And, let us not forget the estimated 750,000 Iranians who were slaughtered in the Iran-Iraq War (1980-1988).
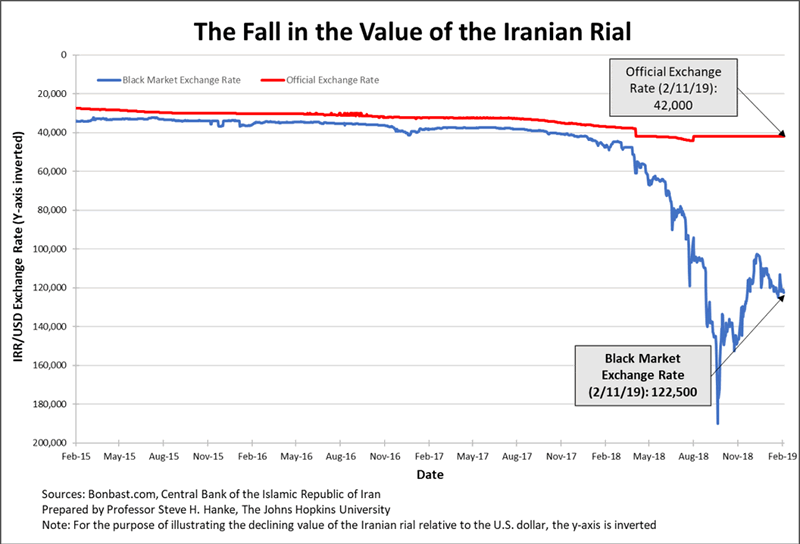
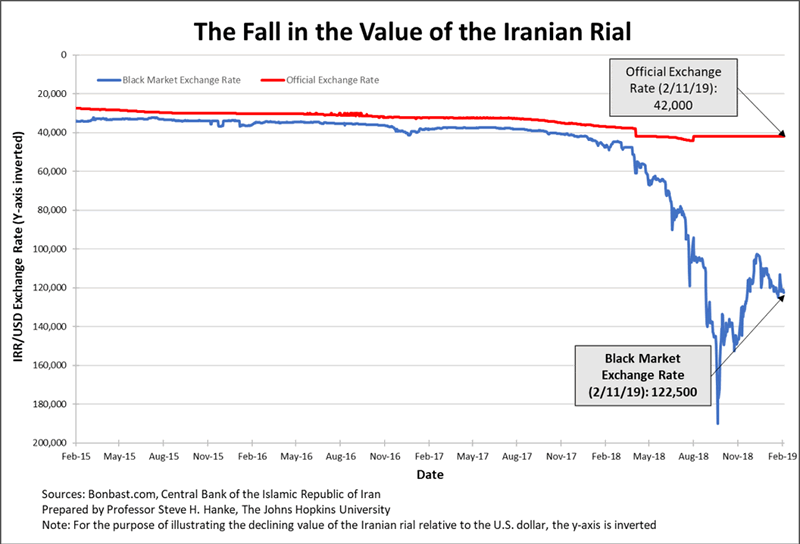
Like the slaughter in that bloody war, the Iranian rial has been slaughtered, too. At the time of the Revolution, the rial fetched 70.5 per U.S. dollar. Today, it takes 122,500 rials to get a greenback. Thanks to the Revolution, the value of the rial has been decimated. The recent picture of the rial’s black market (read: free market) plunge is shown in the chart below.

The Fall in the Value of the Iranian RialProf. Steve H. Hanke
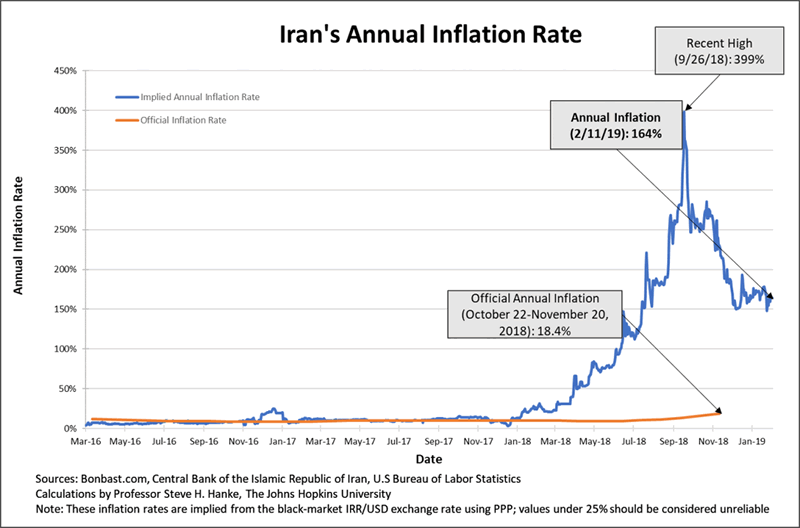
With this crippling currency plunge, inflation has been a constant curse on the Islamic Republic. By using the IRR/USD exchange rate, which represents the most important price in Iran, I measure Iran’s inflation rate. Indeed, the black-market exchange rate can be reliably transformed into accurate measurements of countrywide inflation rates (for those who want to read about the methodology in Farsi). The chart below shows how, with the collapse of the rial’s value against the U.S. dollar, Iran’s implied annual inflation rate has surged to 164%. That is almost nine times higher than the official inflation rate of 18.4%/yr.

Iran's Annual Inflation RateProf. Steve H. Hanke
YOU MAY ALSO LIKE
Another useful dimension for checking Iran’s temperature on a daily (if not minute-by-minute) basis is the black-market premium.
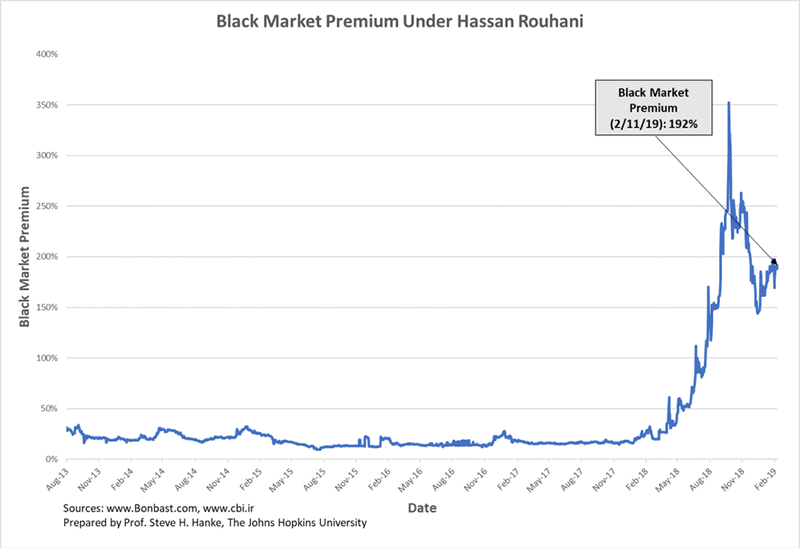
A 192% black-market premium indicates that Iranians were willing to pay 192% more for U.S. dollars in the black-market than if they were lucky enough (read: privileged enough) to obtain them at the official exchange rate.

Black Market Premium CalculationProf. Steve H. Hanke
For a fuller picture of the black-market premium, I have plotted it while President Hassan Rouhani has been in office.

Black Market Premium Under Hassan RouhaniProf. Steve H. Hanke
To follow how Iranians perceive both the internal and foreign zigs and zags of the state of affairs they face, there is no better up-to-the-minute, measure than the IRR/USD black-market premium.
The human condition inhabits a vast continuum between "miserable" and "happy." In the sphere of economics, misery tends to flow from high inflation, steep borrowing costs, and unemployment. The most surefire way to mitigate that misery is economic growth. All else equal, happiness tends to blossom when growth is strong, inflation and interest rates are low, and jobs are plentiful.
Many countries measure and report these economic metrics on a regular basis. Comparing them, nation by nation, can tell us a lot about where in the world people are sad or happy.
The first Misery Index was constructed by economist Art Okun in the 1960s as a way to provide President Lyndon B. Johnson with an easily digestible snapshot of the economy. That original Misery Index was just a simple sum of a nation’s annual inflation rate and its unemployment rate. The Index has been modified several times, first by Robert Barro of Harvard and then by myself.
My modified Misery Index is the sum of the unemployment, inflation, and bank lending rates, minus the percentage change in real GDP per capita. Higher readings on the first three elements are “bad” and make people more miserable. These are offset by a “good” (GDP per capita growth), which is subtracted from the sum of the “bads.” A higher Misery Index score reflects a higher level of “misery.” For consistency and comparability, I use data from the Economist Intelligence Unit to calculate the Misery Index.
Since the Islamic Revolution, Iran’s Misery Index score has always been elevated, indicating misery. In 2017, for example, Iran’s score was 34.6. That was a miserable score, but in 2018 Iranians were much worse off.
For 2018, Iran’s Misery Index Score jumped significantly to 79.7. Although the Grim Reaper has not yet made his final move, Iran remains firmly in his grip.
By Steve H. Hanke
www.cato.org/people/hanke.html
Twitter: @Steve_Hanke
Steve H. Hanke is a Professor of Applied Economics and Co-Director of the Institute for Applied Economics, Global Health, and the Study of Business Enterprise at The Johns Hopkins University in Baltimore. Prof. Hanke is also a Senior Fellow at the Cato Institute in Washington, D.C.; a Distinguished Professor at the Universitas Pelita Harapan in Jakarta, Indonesia; a Senior Advisor at the Renmin University of China’s International Monetary Research Institute in Beijing; a Special Counselor to the Center for Financial Stability in New York; a member of the National Bank of Kuwait’s International Advisory Board (chaired by Sir John Major); a member of the Financial Advisory Council of the United Arab Emirates; and a contributing editor at Globe Asia Magazine.
Copyright © 2019 Steve H. Hanke - All Rights Reserved
Disclaimer: The above is a matter of opinion provided for general information purposes only and is not intended as investment advice. Information and analysis above are derived from sources and utilising methods believed to be reliable, but we cannot accept responsibility for any losses you may incur as a result of this analysis. Individuals should consult with their personal financial advisors.
Steve H. Hanke Archive |
© 2005-2022 http://www.MarketOracle.co.uk - The Market Oracle is a FREE Daily Financial Markets Analysis & Forecasting online publication.


