Stock Market Trend Analysis 2019
Stock-Markets / Stock Markets 2019 Mar 13, 2019 - 12:15 PM GMTBy: Nadeem_Walayat
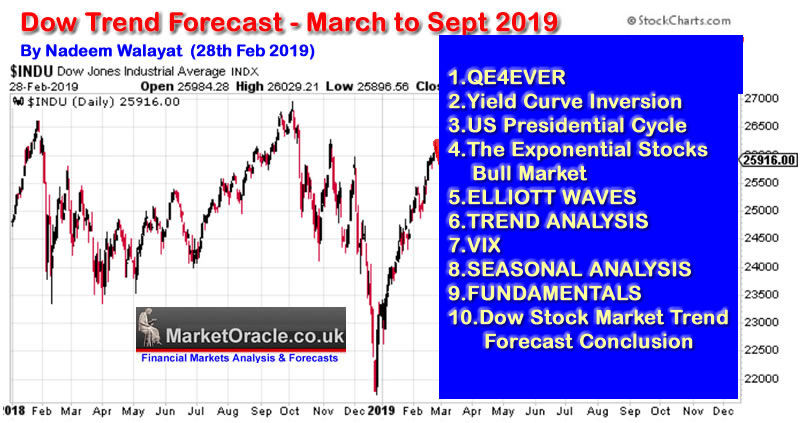
 This is my 6th analysis in a series of 10 that concludes in a 6 month trend forecast for the stock market.
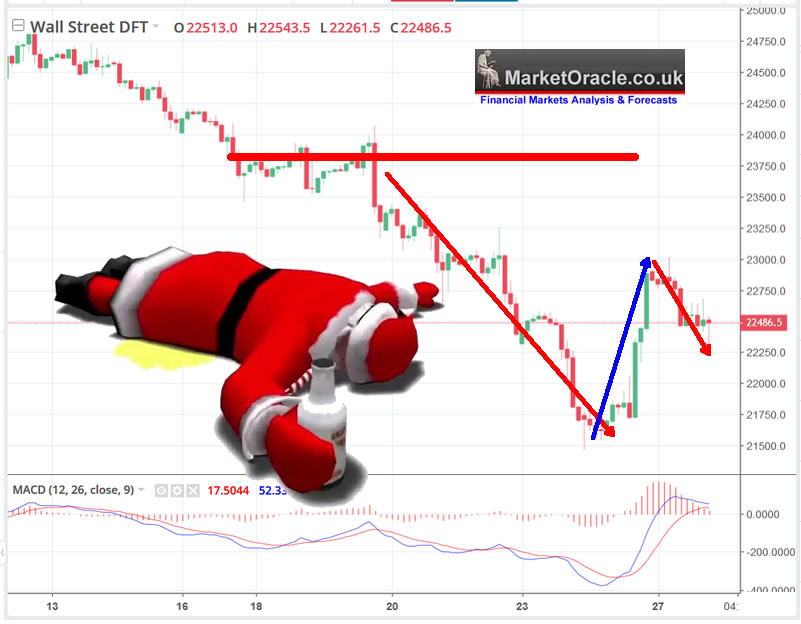
December 2018 saw panic hit the stock market on the failure of the Santa rally to materialse, as those who had bet on such a widely anticipated rally (including myself) were forced to sell out which sent the Dow plunging below support of 23,400 to a low of 21,700. Which is a reminder that we are dealing with the FUTURE, which is UNWRITTEN. So there is always a risk that the market is not going to resolve in the anticipated direction no matter how confident one is at the time that it will.

TREND ANALYSIS

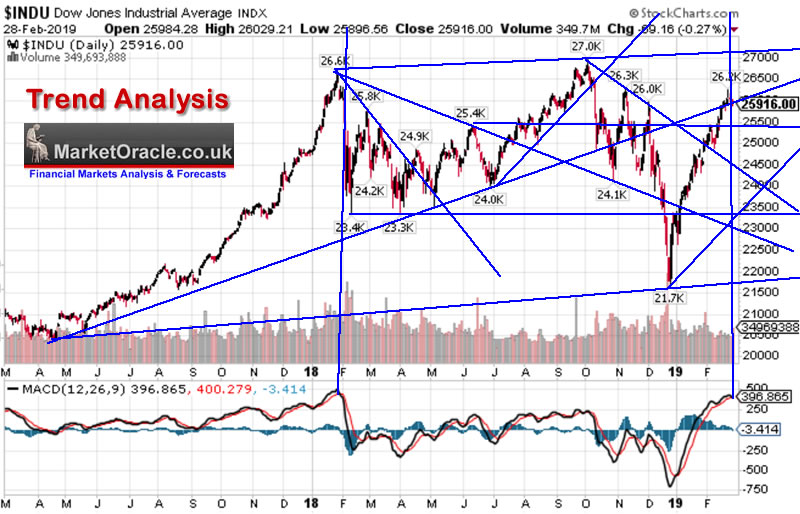
Apart from the false spike to below 23,400. the overall technical pattern remains for the Dow stuck in a trading range where each break of resistance has failed to resolve in a breakout to above 27,000 as the high set in October 2018. However the sharp reversal of the spike lower has once more set the scene for an eventual assault on the 27,000 high.
RESISTANCE : There is heavy over head resistance from 26,200 all the way to 27000.
SUPPORT is along a series of highs from 24,900 to 26,000, though most of these offer minor support. Strong support is along the lows of 24,000, 24,100 and 24,200 which should contain any correction lower.
TREND CHANNELS - Offer support at a distant 23,500. So may not come into play until later in the year.
Overall trend analysis paints a picture of a market that is pending an attempt at breaking out higher. With the immediate trend implying a correction lower to possibly as low as 24,100.
MACD - The MACD is very overbought, similar to where it was in January 2018 that resolved in a 3000 drop in the Dow. A similar move this year would see the Dow fall towards 23,000. SO MACD is signaling an imminent SIGNIFICANT CORRECTION LOWER, to possibly as low as 23,200.
The next analysis in this series will take a look at the VIX in the countdown to my detailed trend forecast for the Stock Market covering the next 6 months to September 2019.
However the whole of this analysis has first been made available to Patrons who support my work.
So for immediate First Access to ALL of my analysis and trend forecasts then do consider becoming a Patron by supporting my work for just $3 per month. https://www.patreon.com/Nadeem_Walayat.
Your Analyst
Nadeem Walayat
Copyright © 2005-2019 Marketoracle.co.uk (Market Oracle Ltd). All rights reserved.
Nadeem Walayat has over 30 years experience of trading derivatives, portfolio management and analysing the financial markets, including one of few who both anticipated and Beat the 1987 Crash. Nadeem's forward looking analysis focuses on UK inflation, economy, interest rates and housing market. He is the author of five ebook's in the The Inflation Mega-Trend and Stocks Stealth Bull Market series that can be downloaded for Free.
 Nadeem is the Editor of The Market Oracle, a FREE Daily Financial Markets Analysis & Forecasting online publication that presents in-depth analysis from over 1000 experienced analysts on a range of views of the probable direction of the financial markets, thus enabling our readers to arrive at an informed opinion on future market direction. http://www.marketoracle.co.uk
Disclaimer: The above is a matter of opinion provided for general information purposes only and is not intended as investment advice. Information and analysis above are derived from sources and utilising methods believed to be reliable, but we cannot accept responsibility for any trading losses you may incur as a result of this analysis. Individuals should consult with their personal financial advisors before engaging in any trading activities.
Nadeem Walayat Archive |
© 2005-2022 http://www.MarketOracle.co.uk - The Market Oracle is a FREE Daily Financial Markets Analysis & Forecasting online publication.


