


Key Recession Indicators and Gold
Commodities / Gold & Silver 2019 Mar 29, 2019 - 06:03 PM GMTBy: Arkadiusz_Sieron

 Do you want to protect your capital against recession? Great, just like us and millions of other people. The key questions is, thus, how to predict that the danger is coming. We invite you to read our today’s article and find out what are key recession indicators – and their relationship with the price of gold.
Do you want to protect your capital against recession? Great, just like us and millions of other people. The key questions is, thus, how to predict that the danger is coming. We have already showed that NBER’s indicators do not signal upcoming economic problems yet. Neither the unemployment rate nor the yield curve.
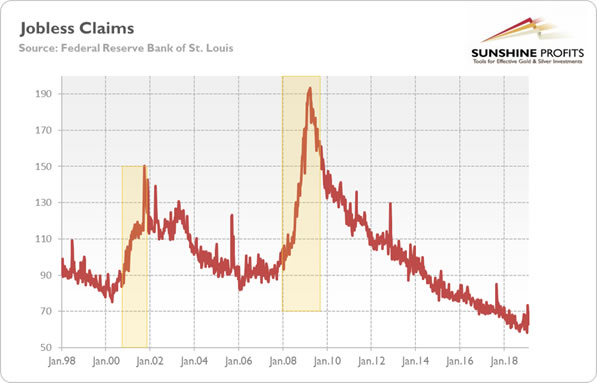
But there are much more potentially useful recession gauges. Let’s analyze them now. Many people, for example, track jobless claims – which show the number of initial filings for state jobless claims nationwide – as it is very intuitive and the rise in them usually heralds declining employment and rising unemployment. However, there is a lot of noise in that weekly data series. Another problem is that the initial jobless claims are used to forecast changes in the employment and unemployment, so why should we not monitor the unemployment rate directly?
But if somebody would like to use jobless claims anyway to predict recession, here you are. As one can see in the chart below, the jobless claims are still in downward trend with the latest bottom reached in January 2019, so this data series does not indicate the upcoming recession (we would expect a bottom much earlier, and then the start of an upward trend, as it was the case prior to the last two recessions).
Chart 1: Initial jobless claims from January 1998 to February 2019 (index, when December 2007 = 100).
Let’s look further. Some analyst say that consumer and business sentiment are important recessionary indicators. It’s clear that sentiment deteriorates during downturns, but it’s not so obvious whether it can actually predict a recession. The chart below displays US consumer and business sentiment indices. As one can see, both measures started to decline a few months before the last two recessions began.
Chart 2: University of Michigan Consumer Sentiment Index (red line) Business Tendency Surveys for Manufacturing (blue line) from January 1998 to December 2018.
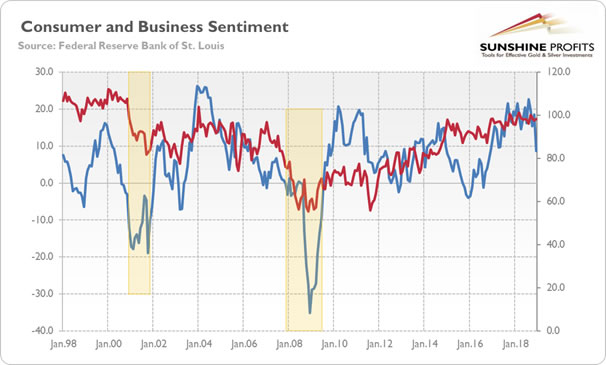
However, both data series are quite volatile with many false positives (for example, consumer sentiment dropped in August 2011, while business sentiment turned negative at the end of 2015). Putting these doubts aside for a moment, let’s note that consumer sentiment is now quite elevated and does not signal the imminent recession. Sorry, gold bulls.
What else is used as a recession indicator? Auto sales and housing permits, for example. The rationale is simple: when there is a recession, people buy fewer cars, while constructors build fewer houses. We paint both data series in the chart below. As one can see, they declined significantly during the Great Recession.
Chart 3: Total Vehicle Sales (red line) and New Private Housing Units Authorized by Building Permits (blue line) from January 1998 to January 2019 (index, when December 2007 = 100).
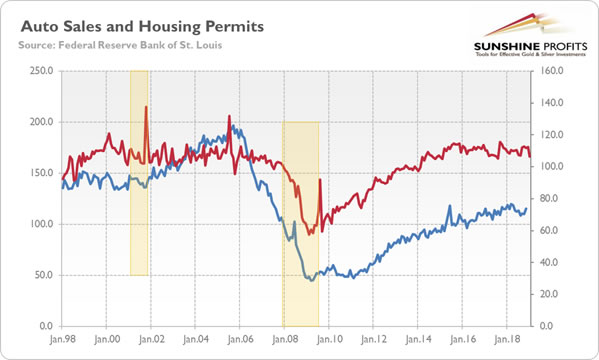
Actually, the housing permits entered the downward trend much earlier, heralding the upcoming storm – but nobody wanted to listen… However, now, they remain in an upward trend. The vehicle sales dropped in January 2019, but it’s too early to indicate recession. Data does not lie, Mr. Gold, the US economy remains solid.
But let’s not give up. What about credit and money supply? After all, according to many economists, especially from the Austrian school, but also from the Bank of International Settlements, the business cycle is a monetary phenomenon. Bernanke may not agree, but Hayek and Friedman definitely would (and possibly Greenspan would also agree). Recession is an abrupt end of the boom, when the monetary policy is easy, while the credit is plentiful. Indeed, as the chart below shows, prior to the Great Recession, the credit-to-GDP rose to a very high level, which was clearly unsustainable.
Chart 4: Credit to GDP and M2 Money Supply to GDP from Q1 1998 to Q2 2018
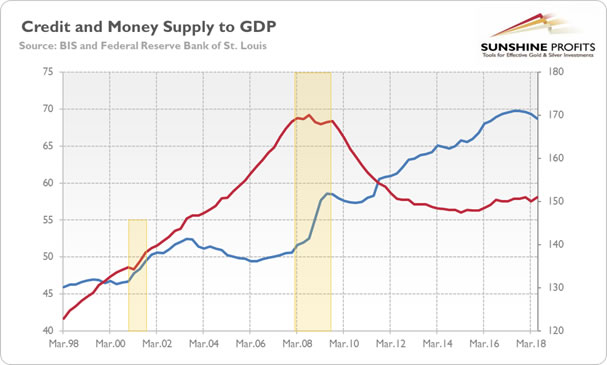
However, the credit-to-GDP ratio has declined after the Great Recession and stabilized at more normal level. We do not see any danger here, at least not for now. And when it comes to the ratio of the M2 money supply to GDP, it reached a trough before the last two recessions, as one can see in the chart above. But recently it has reached a peak rather than the bottom. Again, the monetary analysis does not authorize us to call for an alarm. It might be bad news for the gold market.
But it does not have to be. It might be the case that we are looking for a recession not where we should be. All analysts focus on the US economy, but, well, this time the thunder may strike China first. And gold may also shine without recession. We do not expect recession this year, but we believe that 2019 will be better for the yellow metal than 2018, anyway, because of less hawkish monetary policy and less accommodative fiscal policy, and, thus, weaker US dollar. The bullish case may not play out until the second half of the year, though.
Thank you.
If you enjoyed the above analysis and would you like to know more about the gold ETFs and their impact on gold price, we invite you to read the April Market Overview report. If you're interested in the detailed price analysis and price projections with targets, we invite you to sign up for our Gold & Silver Trading Alerts . If you're not ready to subscribe at this time, we invite you to sign up for our gold newsletter and stay up-to-date with our latest free articles. It's free and you can unsubscribe anytime.
Arkadiusz Sieron
Sunshine Profits‘ Market Overview Editor
Disclaimer
All essays, research and information found above represent analyses and opinions of Przemyslaw Radomski, CFA and Sunshine Profits' associates only. As such, it may prove wrong and be a subject to change without notice. Opinions and analyses were based on data available to authors of respective essays at the time of writing. Although the information provided above is based on careful research and sources that are believed to be accurate, Przemyslaw Radomski, CFA and his associates do not guarantee the accuracy or thoroughness of the data or information reported. The opinions published above are neither an offer nor a recommendation to purchase or sell any securities. Mr. Radomski is not a Registered Securities Advisor. By reading Przemyslaw Radomski's, CFA reports you fully agree that he will not be held responsible or liable for any decisions you make regarding any information provided in these reports. Investing, trading and speculation in any financial markets may involve high risk of loss. Przemyslaw Radomski, CFA, Sunshine Profits' employees and affiliates as well as members of their families may have a short or long position in any securities, including those mentioned in any of the reports or essays, and may make additional purchases and/or sales of those securities without notice.
Arkadiusz Sieron Archive |
© 2005-2022 http://www.MarketOracle.co.uk - The Market Oracle is a FREE Daily Financial Markets Analysis & Forecasting online publication.