


Stock Market Eerie Calm Before the Storm?
Stock-Markets / Stock Markets 2019 Mar 30, 2019 - 06:14 PM GMTBy: Troy_Bombardia

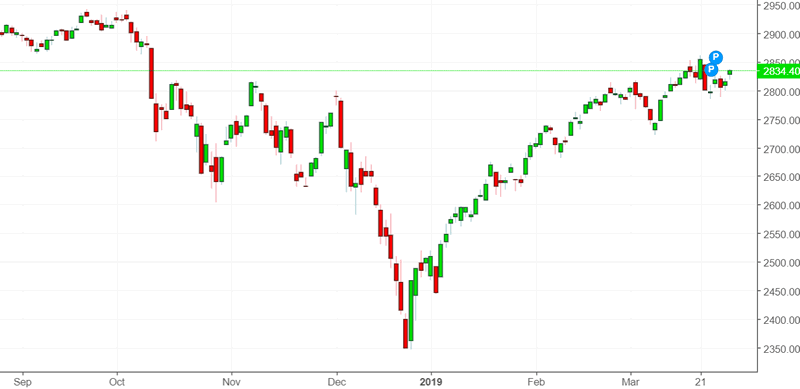
It’s been a terrific Q1 for stocks and bonds. Yet as the stock market and bond market rallies continue, the bearish chorus among traders and financial professionals grows louder.
Go here to understand our fundamentals-driven long term outlook.
Let’s determine the stock market’s most probable medium term direction by objectively quantifying technical analysis. For reference, here’s the random probability of the U.S. stock market going up on any given day.

*Probability ≠ certainty. Past performance ≠ future performance. But if you don’t use the past as a guide, you are blindly “guessing” the future.
The eerie calm before the storm?
Bloomberg perfectly summed up sentiment among traders and financial professionals with this article.
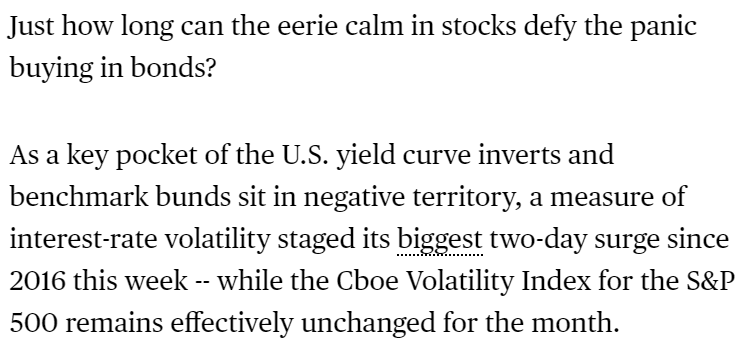
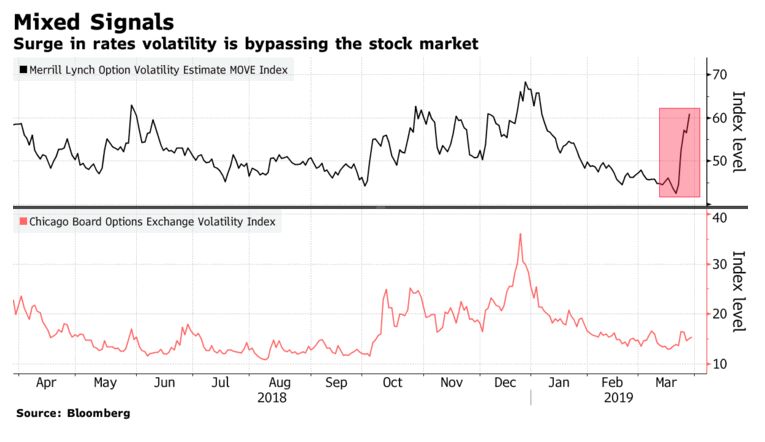
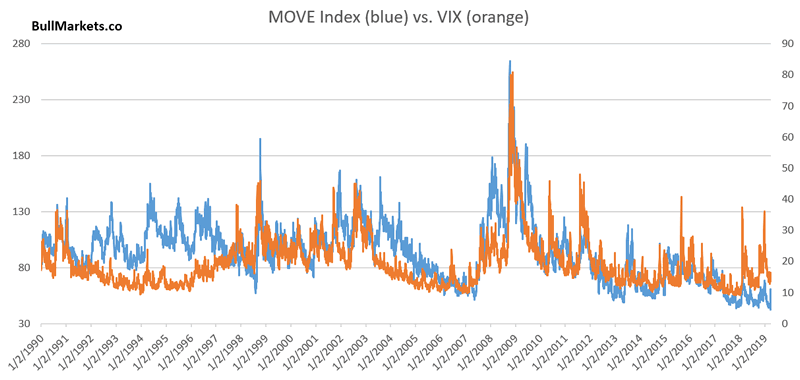
The divergence between stock market and bond market volatility is indeed puzzling, considering that these 2 often move together.
This chart demonstrates the recent divergence between MOVE (bond market volatility) and VIX (stock market volatility)
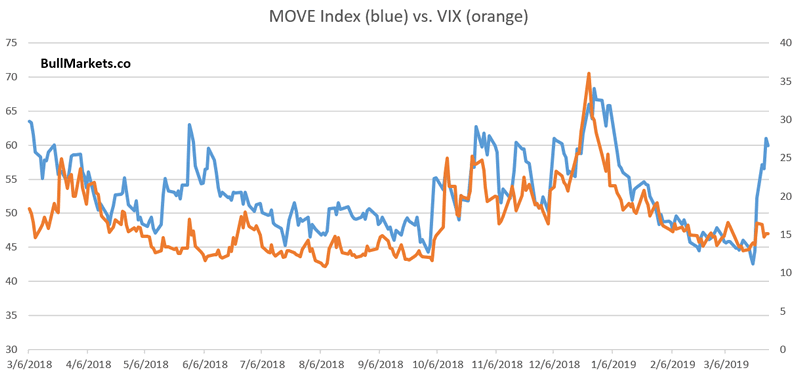
Here’s a longer term chart, demonstrating that these 2 indices typically move together
Click here to download the MOVE index in Excel
So how bearish is this for the S&P (and bullish for VIX)?
Here’s what happens next to the S&P when MOVE spikes 40%+ over the past 5 days while VIX rises less than 10%.
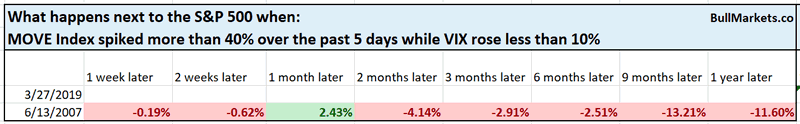
From 1990 – present, this has only happened 1 other time (June 2007).
Sounds ominous, doesn’t it?
Let’s relax the parameters a little. N=1 doesn’t mean much.
Here’s what happens next to the S&P when MOVE spikes 30%+ over the past 5 days while VIX rises less than 10%.
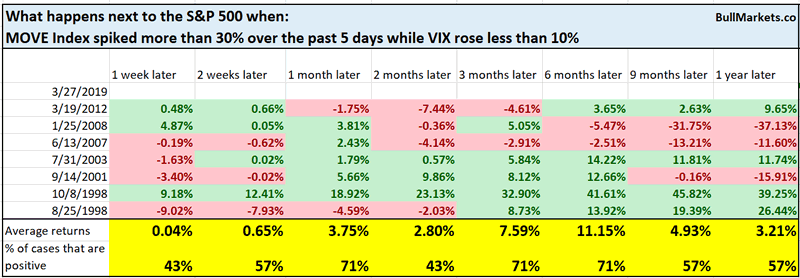
Some bearish, and some bullish. Worth watching.
Monthly statistics
Now that March is over, we can look at some monthly statistics for the stock market. These stats use each month’s CLOSE $ (so 3/1/2019 = the closing price for March 2019).
Seasonality
This has been one of the strongest starts to the year, with the S&P up more than 13% from January-March 2019.
Similar rallies usually saw the S&P push higher throughout the rest of the year.
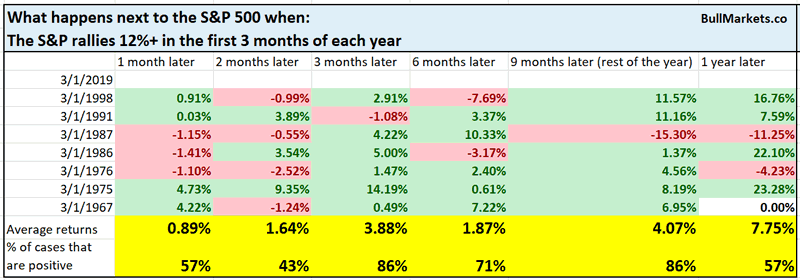
Seasonality is of tertiary importance.
USD
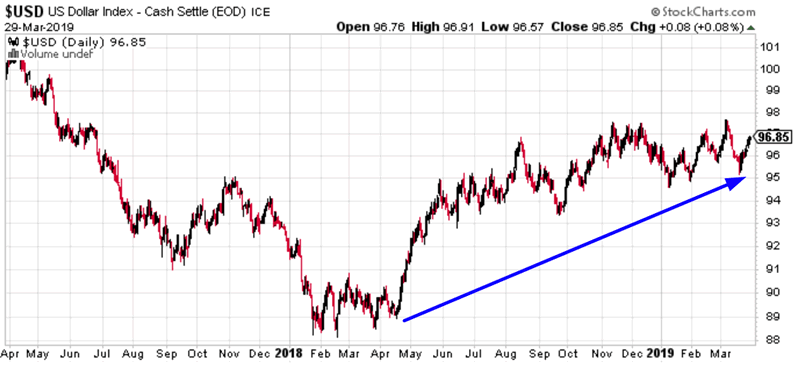
The USD Index has been rising over the past year, and is now up 4 quarters in a row.
Here’s what happens next to the S&P when the USD Index rises 4 quarters in a row.
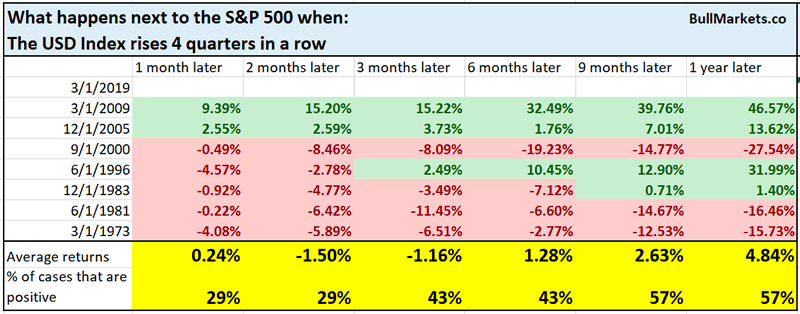
This does appear to be a short term headwind for the S&P.
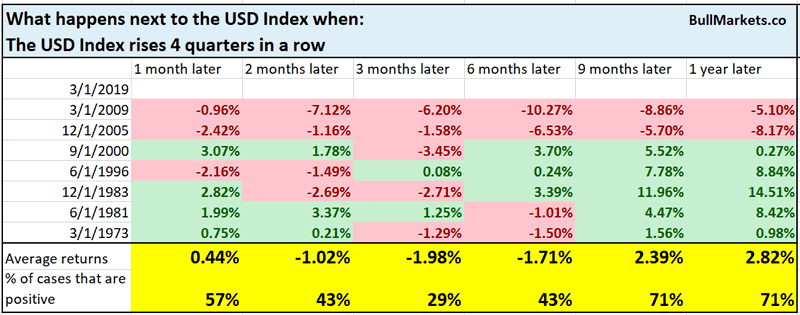
Here’s what happens next to the USD Index.
Treasury Bonds
While the S&P 500 rallied over the past 3 months, Treasury yields have fallen. The popular story in the media is that “this is bad for stocks”, because the bond market is smarter than the stock market. (Stocks decoupling from yields!)
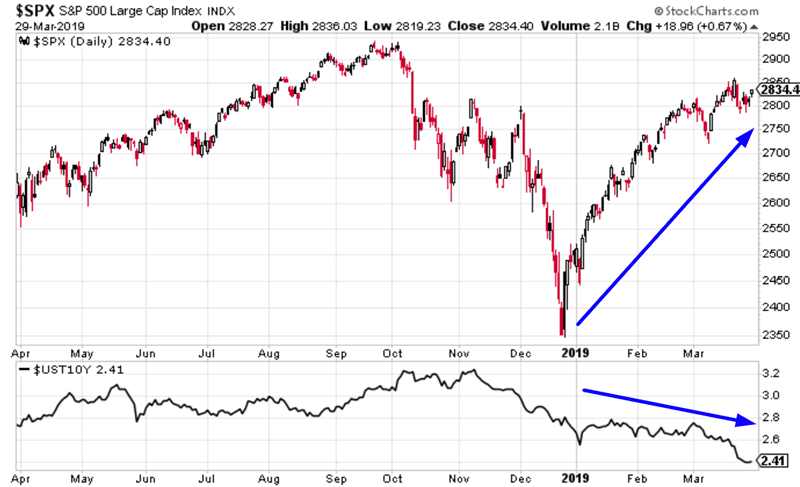
Well technically, stocks have been “decoupling” from interest rates for 40 years.
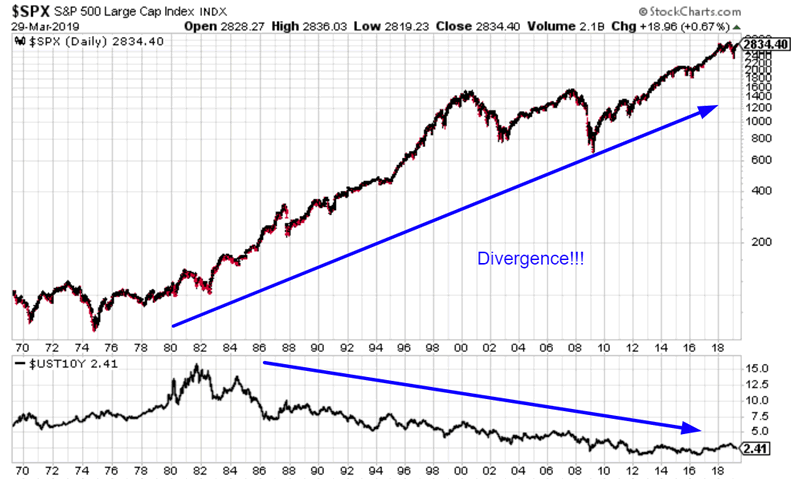
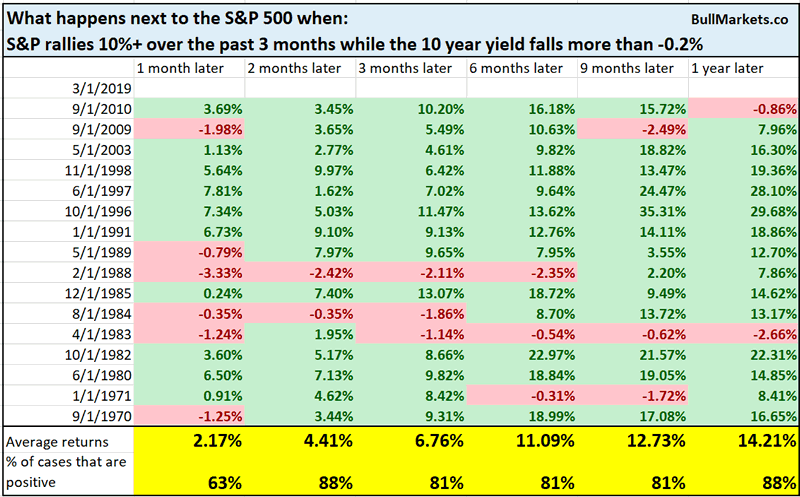
Here’s what happens next to the S&P when it rallies 10%+ over the past 3 months while the 10 year yield falls more than -0.2%
Bond Spreads
Another popular way of looking at the bond market is to look at the spread between riskier corporate bonds and risk-free Treasury bonds. This spread tends to move inversely to the S&P 500. (Michael Milken’s discovery in the 1980s was that junk bonds often act like stock prices).
While the stock market has rallied, the BAA Corporate Bond Spread has not flattened significantly.
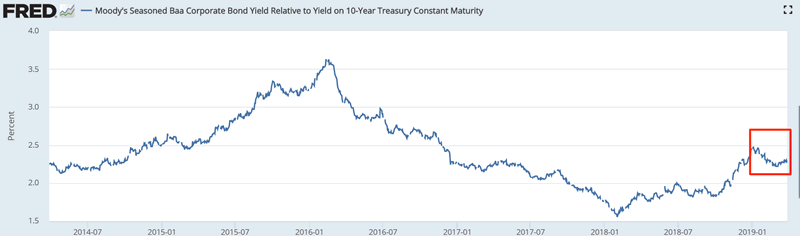
Seems ominous, doesn’t it? Surely the bond market “knows something the stock market doesnt”.
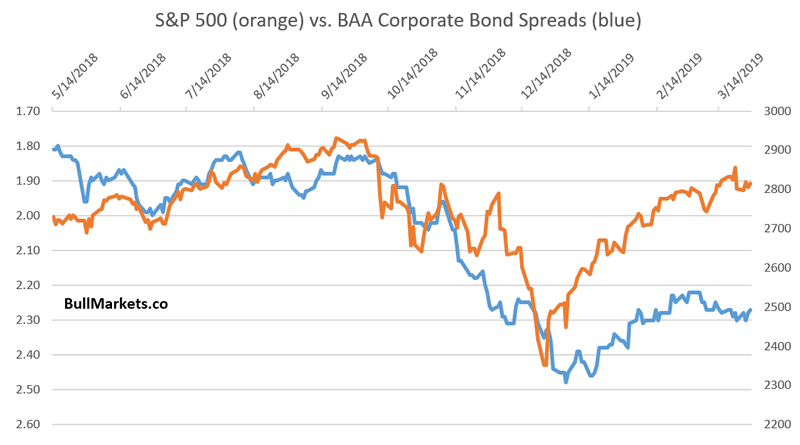
Here’s what happens next to the S&P when it rallies 10%+ over the past 3 months while BAA Spreads narrow by less than -0.2%
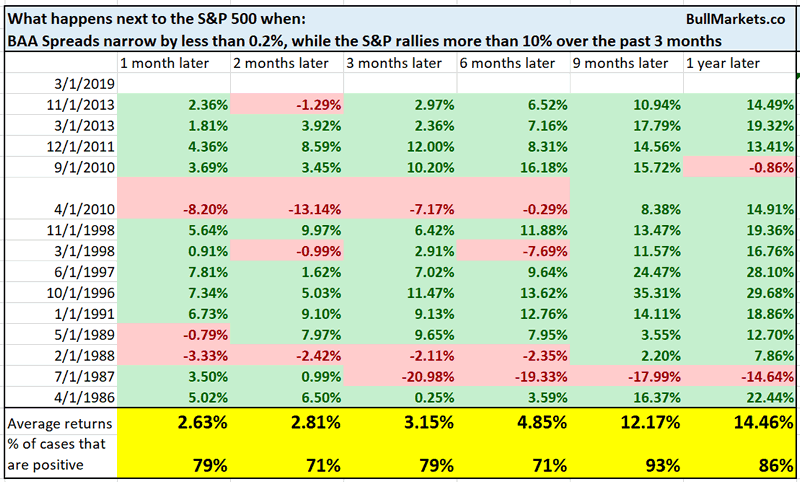
This happens quite often, and is not ominous for stocks.
Federal government tax receipts
A chart from a popular permabear caught my eye. (The permabear shall remain unnamed, for reasons I will soon explain).
As you can see from the following chart, % growth in Federal tax receipts has been negative for a few consecutive quarters. According to the permabear, “this is a hallmark of economic recessions”.
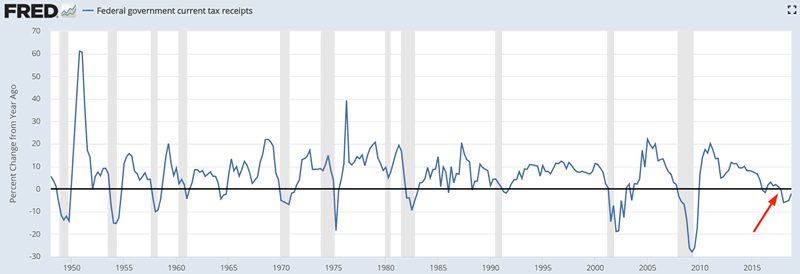
This statement is flawed on many levels.
- Yes, federal tax receipt growth does turn negative during recessions. (Shrinking GDP = less taxes).
- However, there are many other reasons why tax receipts would decline, such as a tax cut.
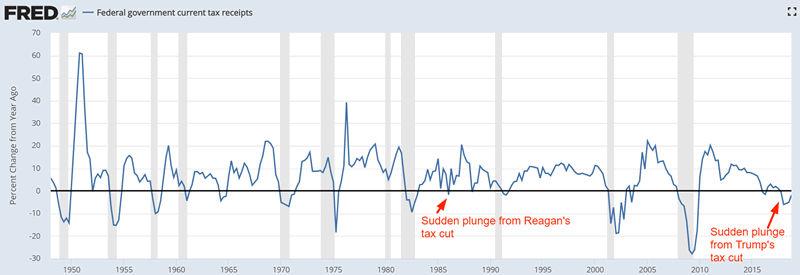
- The Trump tax cut caused a sudden decline in federal taxes. The receipt decline in tax receipts has very little to do with “economic weakness/recession”.
You can see that Trump’s tax cut caused federal tax receipt growth to plunge, similar to Reagan’s tax cut in 1986.
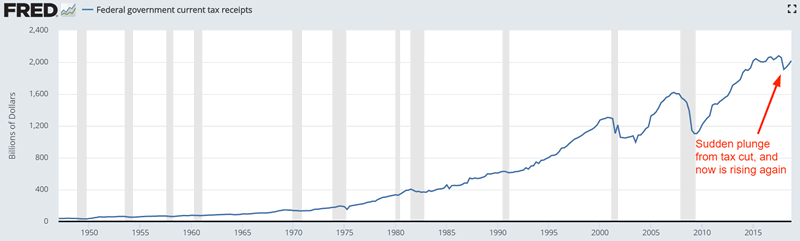
Here’s a chart of actual Federal tax receipts. You can see that tax receipts are once again rising now that the effects of the tax cut are wearing off.
So why is this permabear unnamed? Because this is the definition of a charlatan:
Someone who knowingly presents false facts and covers up the truth to sell a story and increase his/her popularity.
This permabear is a regular on CNBC and is a trading “guru”. Surely a finance guru must know the difference between a recession-driven decline in tax receipts vs. a tax cut-driven decline in tax receipts? That’s like saying you spent 10 years studying mathematics yet you don’t know 2+2=4.
To mislead people to sell a point (and thereby sell subscription services) is in my book the definition of a charlatan. I will not give famous charlatans any more attention than they already have.

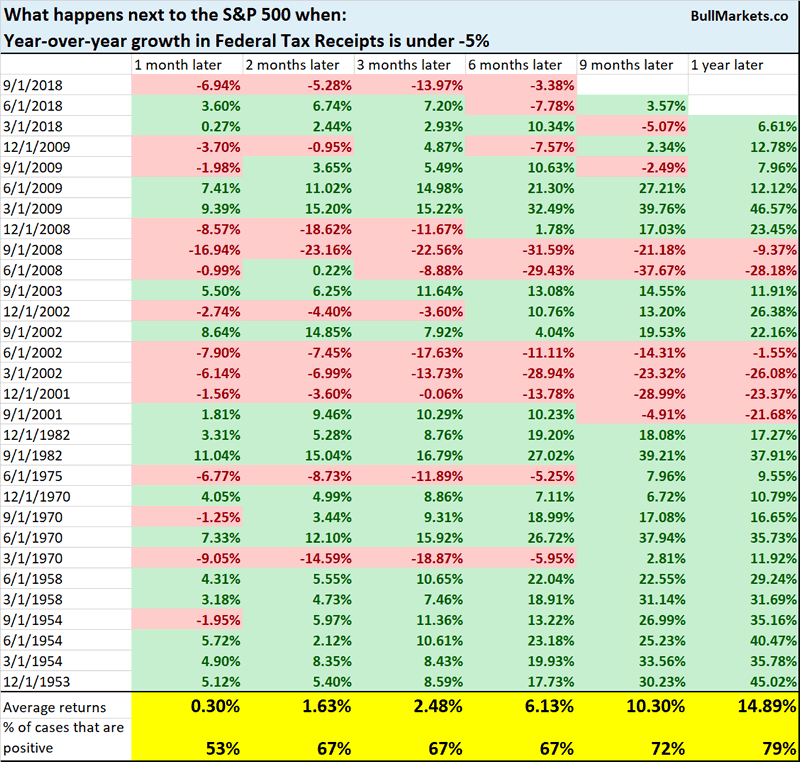
Anyways, here’s what happens next to the S&P 500 when the year-over-year growth in Federal Tax Receipts is under -5%
IPOs
And lastly, you’ve probably heard about Lyft’s IPO today. (Lyft is a #2 to Uber).
(Over the years, I’ve found IPOs to be more and more like a ponzi scheme. Private investors and VC’s push unprofitable but innovative startups to sky-high valuations. Then unload the stock to the public and peak valuations. Or as they said in Wolf of Wall Street, “unload the dog shit”).
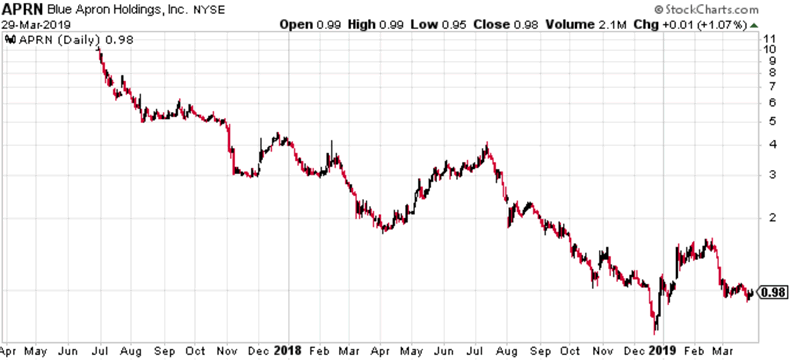
Here’s Blue Apron.
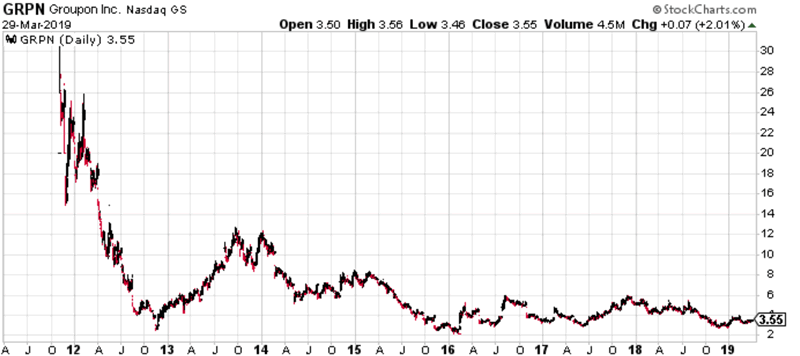
Here’s Groupon.
2019 will be a banner year for IPOs, with mega-unicorns like Airbnb and Uber rushing out of the gates. What better time to unload your high-flying tech stock than towards the end of a bull market and economic expansion? The longer you wait, the more you risk a recession that will kill your IPO. In VC lingo this is called “an exit”.
*There’s always a relative winner and a relative loser in any deal. The VCs and early private investors use IPOs to unload their stocks. Warren Buffett is against buying IPO stocks. As he says “in any deal, if you don’t know who the dumb money is, then you are the dumb money”.
I have no doubt that most of these unprofitable unicorns will go bankrupt in the next economic recession. When you can’t raise money because public markets have dried up and you can’t earn money through profits, sooner or later you will run out of cash.
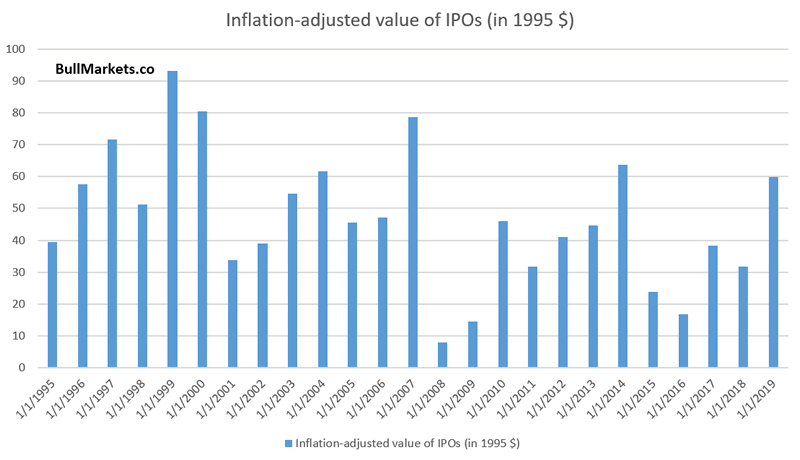
Bloomberg reports that the total dollar value of IPOs in 2019 will be equal to that of 2000 and 2007!
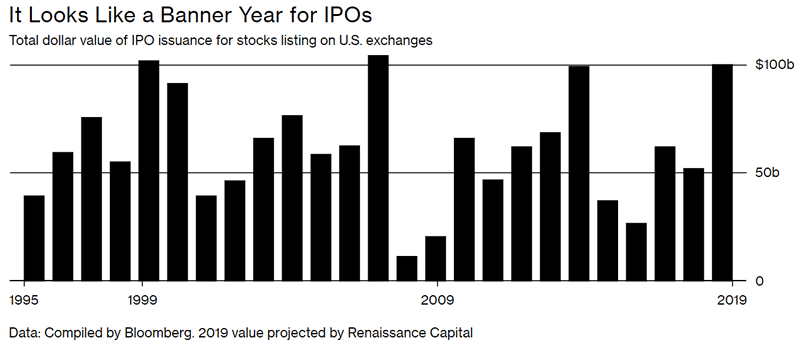
While this may seem ominous, it fails to take inflation into account. When you adjust the value of IPOs for inflation, this year is not “just like 2000 and 2007”.
Read What the weakening macro data means for the stock market
Conclusion
Here is our discretionary market outlook:
- The U.S. stock market’s long term risk:reward is no longer bullish. In a most optimistic scenario, the bull market probably has 1 year left. Long term risk:reward is more important than trying to predict exact tops and bottoms.
- The medium term direction (e.g. next 6-9 months) is mostly mixed, although there is a bullish lean.
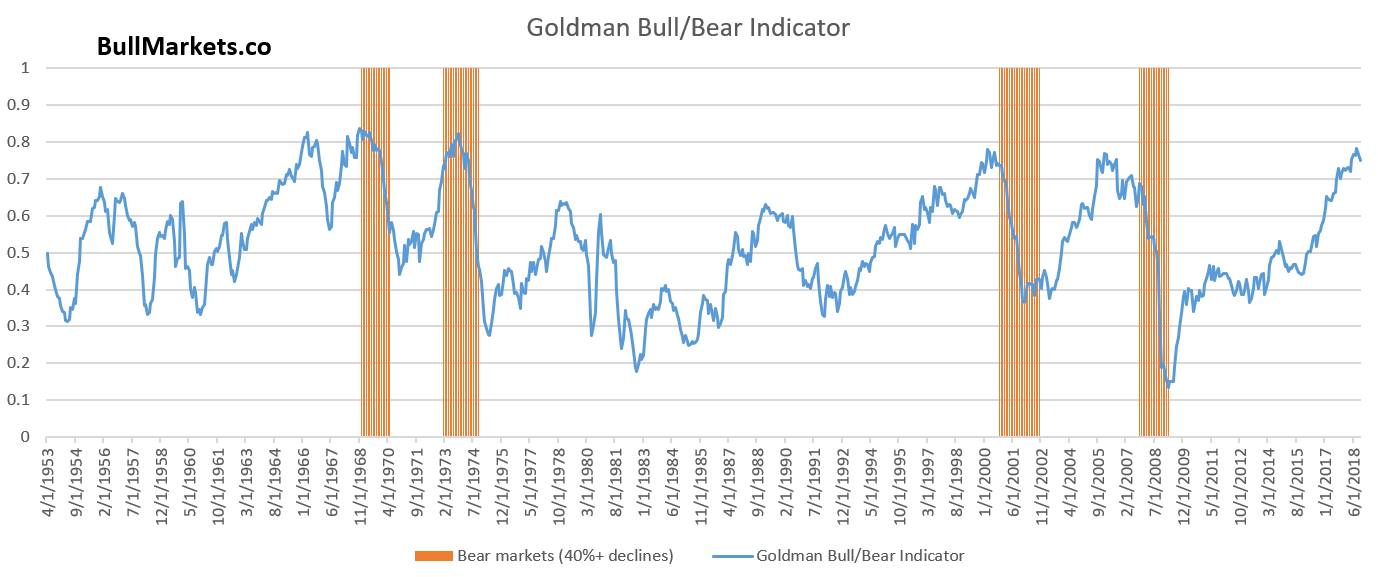
Goldman Sachs’ Bull/Bear Indicator demonstrates that while the bull market’s top isn’t necessarily in, risk:reward does favor long term bears.
Our discretionary outlook is not a reflection of how we’re trading the markets right now. We trade based on our quantitative trading models.
Members can see exactly how we’re trading the U.S. stock market right now based on our trading models.
Click here for more market studies
By Troy Bombardia
I’m Troy Bombardia, the author behind BullMarkets.co. I used to run a hedge fund, but closed it due to a major health scare. I am now enjoying life and simply investing/trading my own account. I focus on long term performance and ignore short term performance.
Copyright 2019 © Troy Bombardia - All Rights Reserved
Disclaimer: The above is a matter of opinion provided for general information purposes only and is not intended as investment advice. Information and analysis above are derived from sources and utilising methods believed to be reliable, but we cannot accept responsibility for any losses you may incur as a result of this analysis. Individuals should consult with their personal financial advisors.
© 2005-2022 http://www.MarketOracle.co.uk - The Market Oracle is a FREE Daily Financial Markets Analysis & Forecasting online publication.