Gold and Silver Still on the Road to a Low Risk Setup
Commodities / Gold & Silver 2019 Apr 11, 2019 - 06:55 PM GMTBy: Gary_Tanashian
 From a post on gold and silver on Tuesday…
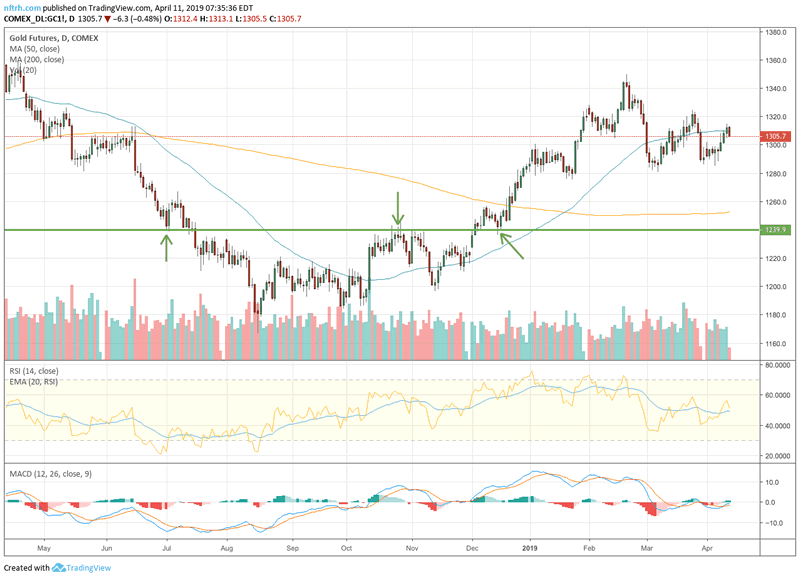
Very simply, if it’s an H&S it’s a minor one with a target to the SMA 200 or short-term lateral support. Gold has curled back up to test the underside of its SMA 50. A takeout of 1310 and then the March high could put yeller back in business. Otherwise, don’t personalize it. A test of the SMA 200 would be normal.
The H&S was not my thing. I tend not to get overly excited about short-term patterns and surely do not announce them far and wide to stir people up. It was a product of the gold community, some members of which have been flipping in head spinning fashion between bullish and bearish views. I note it again because I don’t want that stink on me. The upside and downside parameters above were my stuff.
Per the NFTRH Trade Log, I shorted a chunk of GLD yesterday (while remaining long gold stocks and even more so, cyclical assets on balance) as gold poked the SMA 50 per the Futures chart below. Gold’s pullback today was not engineered by the Fed or da Boyz or da PPT, PtB, Trump, Mnuchin or some nefarious super algo. It’s normal. Okay conspiracy mongers? N.O.R.M.A.L.
Click the chart for a clearer view of gold’s situation at the SMA 50. If it does not clear the March high the SMA 200 (at least) continues to yawn with its gaping maw. 1240 is also doable.
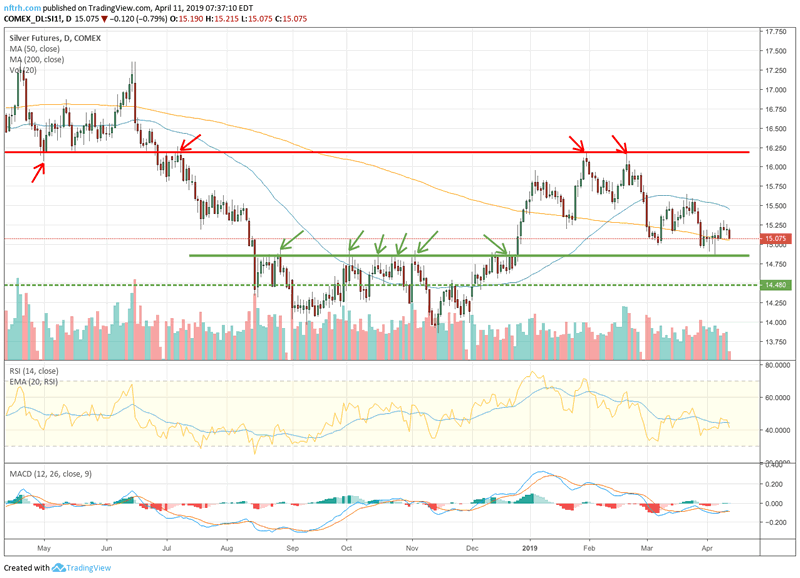
Silver looks particularly lame, but ironically this is the metal I am expecting to bottom first with the question being the two noted (green) support areas. Don’t rule out 14.50.
The Commitments of Traders have simply not been ready yet, despite declarations to the contrary coming out of the community lately. It’s the CoT trends that matter and they have not appeared complete to a contrary bullish situation.
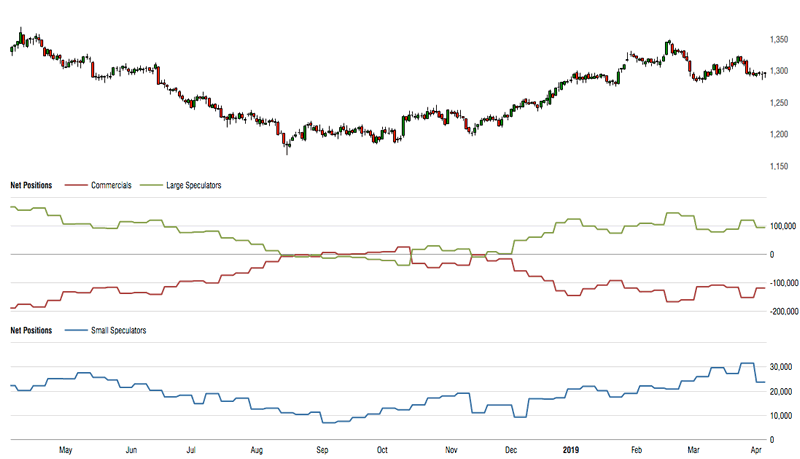
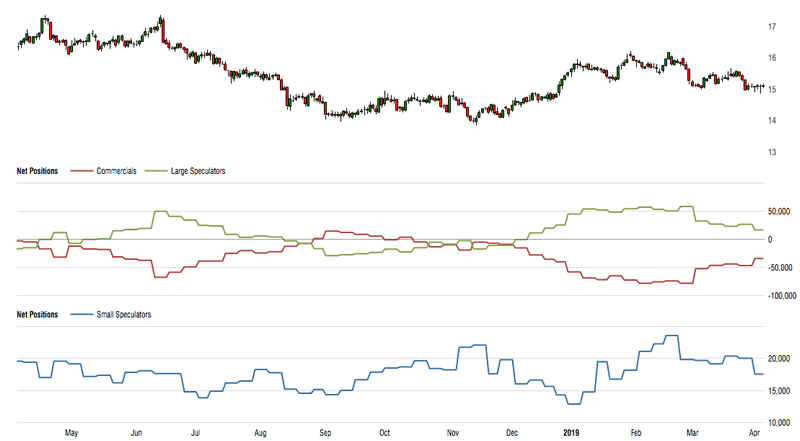
Here they are as presented in NFTRH 546 (April 7) with the data as of April 2.
First of all, the Commitments of Traders trends do not yet appear complete. While moving in the right direction for an eventual low risk condition, gold’s CoT is more consistent with a top than a bottom. On a slightly positive note, small Specs finally started getting less bullish.
The silver CoT is much better, but there is vulnerability in that it is not at an extreme, which is usually required to make a sustainable silver low.
Meanwhile, there is much more to the story including the ratios of the miners to the metals and the all-important macro and sector fundamentals. The above are just two angles for analyzing a situation that requires several more to gain full perspective. It’s not as simple as ‘dovish Fed = bullish gold and silver and if it does not happen right away it’s manipulation!’
The process has been ongoing since gold became extremely overbought in relation to cyclical and risk ‘on’ US/global assets and markets. As suggested above, “don’t personalize it” and for crying out loud when you read stuff about China’s new economic growth * and its demand for gold (as is currently being promoted as a major gold price driver) tune that crap out!
I have been as constructive on China as the next guy (and probably before the next guy in the midst of the Trade War furor in Q4 2018), but the linkage to bullish gold, like so many other cyclical inflation-related promos is pure fantasy. The two situations can happen simultaneously as they did early last decade, but the old ‘China demand’ promo would at best drive other industrial and pro-economic assets (and also silver) better than gold.
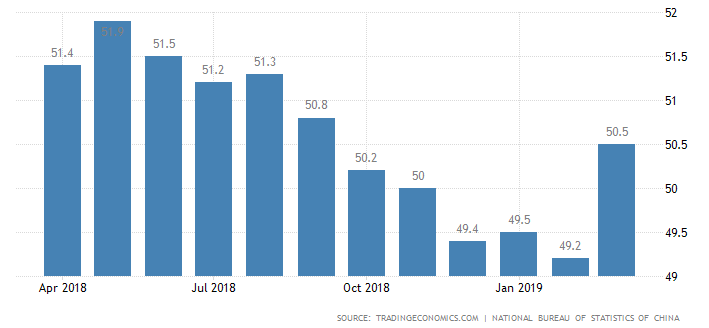
* And we can tap the breaks on the enthusiasm based on just 1 month of China PMI growth. Here’s the chart from NFTRH 546. The spike was in line with our constructive view, but there is more work to do.
You can also keep up to date with plenty of actionable public content at NFTRH.com by using the email form on the right sidebar and get even more by joining our free eLetter. Or follow via Twitter ;@BiiwiiNFTRH, StockTwits or RSS. Also check out the quality market writers at Biiwii.com.
By Gary Tanashian
© 2019 Copyright Gary Tanashian - All Rights Reserved
Disclaimer: The above is a matter of opinion provided for general information purposes only and is not intended as investment advice. Information and analysis above are derived from sources and utilising methods believed to be reliable, but we cannot accept responsibility for any losses you may incur as a result of this analysis. Individuals should consult with their personal financial advisors.
Gary Tanashian Archive |
© 2005-2022 http://www.MarketOracle.co.uk - The Market Oracle is a FREE Daily Financial Markets Analysis & Forecasting online publication.


