


SPX Goldilocks Now, But She’ll Be Vanquished
Stock-Markets / Stock Markets 2019 Apr 26, 2019 - 01:57 PM GMTBy: Gary_Tanashian

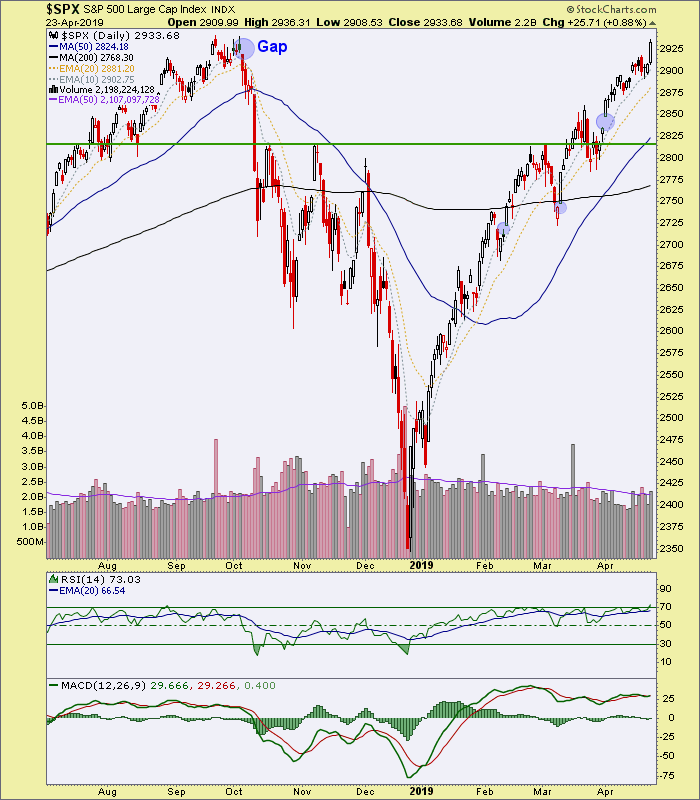
 Just one look at the daily chart of SPX tells us – in hindsight – that this may have all been about gap acquisition. I was completely right and righteous to be bullish on the Christmas Eve massacre low, right on up to the 50 day moving average, which was the original target.
After that I was compelled by the market’s technicals to be bullish for a drive to the SMA 200, and then 2815 resistance, and then… a top-test. I not only felt not righteous with these compulsions, I felt a little soiled. Hey, it’s just a human (as opposed to a newsletter writer/market commentator) talking about human feelings.
There is a difference between being contrary and willingly bullish and being compelled to be bullish. I don’t like the feeling of that second thing very much. Anyway, there is a gap and do you know what? Last summer’s rally filled a similar gap (not shown here) from late January 2018, proceeded upward into a nice bull trap, and then October happened. FYI. The bears were disoriented and thus pissed all last summer. But any self respecting bull trap would by definition piss the bears off because it’s the same psychology that traps the bulls, only in reverse.
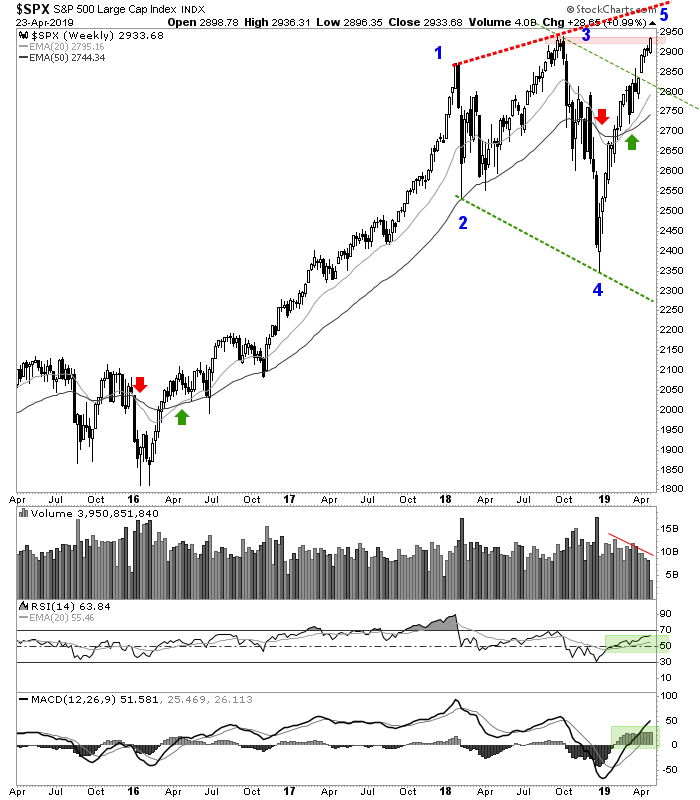
So SPX is finally at its top-test limit, with its leadership chain (SOX>NDX>SPX) still strong as NDX is at new highs and SOX is well into new highs. We also have the scenario of SPX to 3000 () open if it is to hit point 5 on a potential Megaphone.
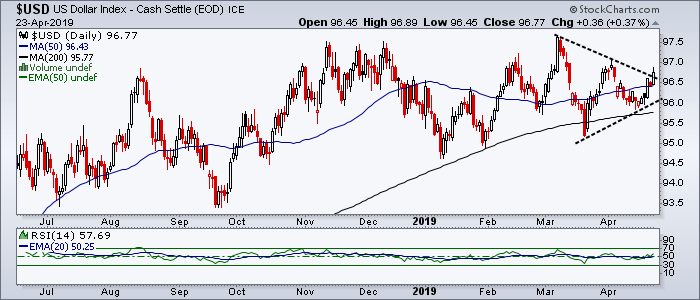
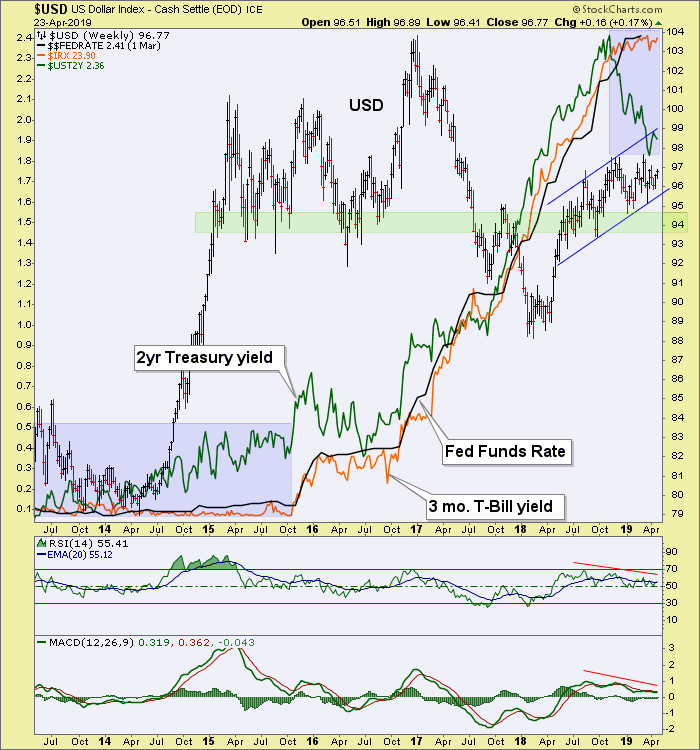
Where Goldilocks comes in is reflected in the still-strong US dollar, which is threatening to break upward out of the nose of a Symmetrical Triangle, per this chart from NFTRH 548.
She is reflected in sideways going ‘inflation gauges’.
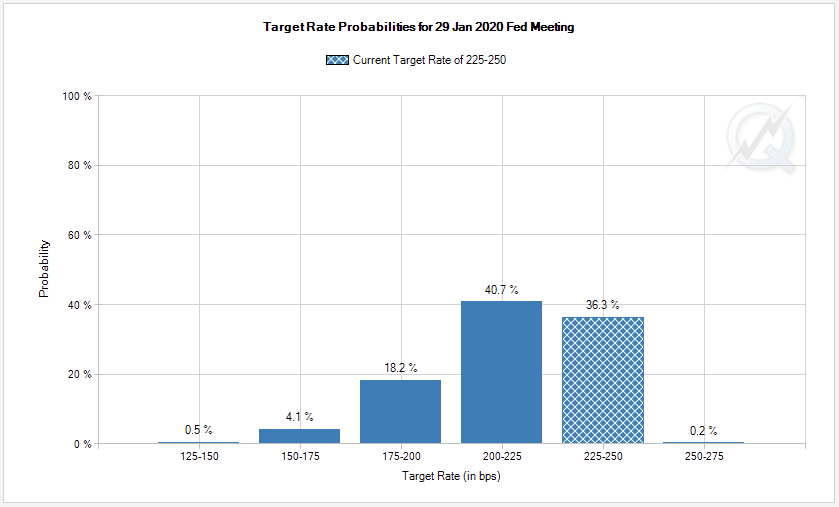
This has been the case for all of 2019 as relief sweeps over US and global markets and the US maintains its leadership. To make matters worse (or better, depending on how you view it), not only has the wondrous stock rally not changed the Fed’s mind about a rate hike in 2019 (according to CME futures traders predicting no chance of a hike next week), they still predict no hike in 2019 and increasing odds of a cut or two by year-end.
A result is a stock market at and beyond its highs, the Fed on hold, the 2yr yield still in submission (beckoning the Fed to ease) and yet the US dollar gaining the global bid, same as it seems it always is.
As long as this condition persists she is going to remain in da house, sleeping in the little bear’s bed, eating his porridge and pissing some people off. She only annoys me, because it is my job to only be annoyed on occasion but to remain steady and dealing with what is.
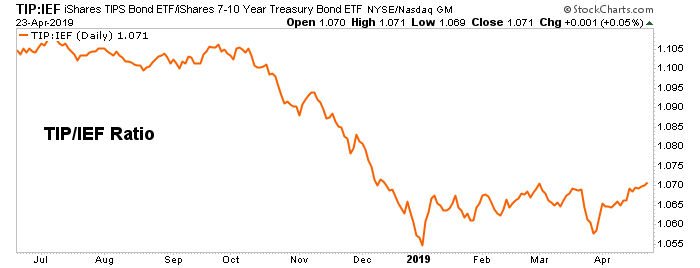
I also think that with patience through this obnoxiousness, the macro is going to break one way or the other, and probably in 2019. That would be a yield curve steepener under either deflationary or inflationary pains. Ref. the TIP/IEF ratio above. We’re not going to go perma-sideways.
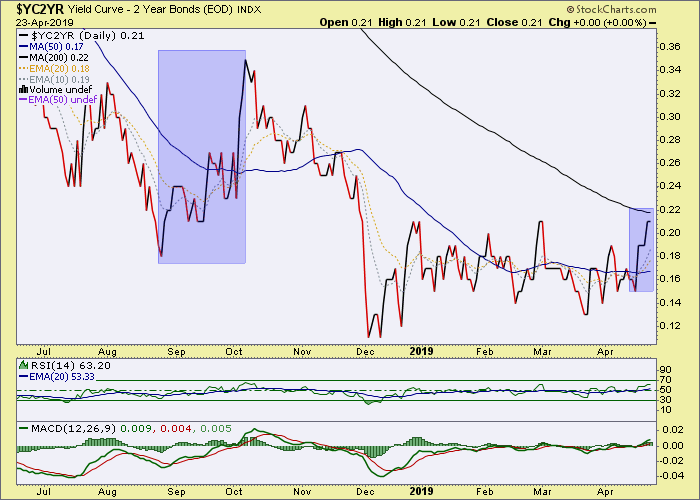
So here is the big daddy of macro indicators, our former Amigo #3, the Yield Curve. If you look carefully you’ll notice and recall that SPX started to fade at the end of September, after the curve had begun steepening (ill-fated though that little steepener was on the big picture). This time the curve has jumped again in similar fashion against a manic bullish stock market.
I don’t want to get bears’ hopes up in the micro-term, but what’s different now from September? RSI and MACD are more mature and set up better. While a million miles away from the 200 day average in September the curve is approaching it now. Trends change in much slower time than your brain processes its desires. So… patience. The macro may change yet and that little bastard will get kicked out of the house sooner or later.
Subscribe to NFTRH Premium (monthly at USD $33.50 or a 14% discounted yearly at USD $345.00) for an in-depth weekly market report, interim market updates and NFTRH+ chart and trade setup ideas, all archived/posted at the site and delivered to your inbox.
You can also keep up to date with plenty of actionable public content at NFTRH.com by using the email form on the right sidebar and get even more by joining our free eLetter. Or follow via Twitter ;@BiiwiiNFTRH, StockTwits or RSS. Also check out the quality market writers at Biiwii.com.
By Gary Tanashian
© 2019 Copyright Gary Tanashian - All Rights Reserved
Disclaimer: The above is a matter of opinion provided for general information purposes only and is not intended as investment advice. Information and analysis above are derived from sources and utilising methods believed to be reliable, but we cannot accept responsibility for any losses you may incur as a result of this analysis. Individuals should consult with their personal financial advisors.
Gary Tanashian Archive |
© 2005-2022 http://www.MarketOracle.co.uk - The Market Oracle is a FREE Daily Financial Markets Analysis & Forecasting online publication.